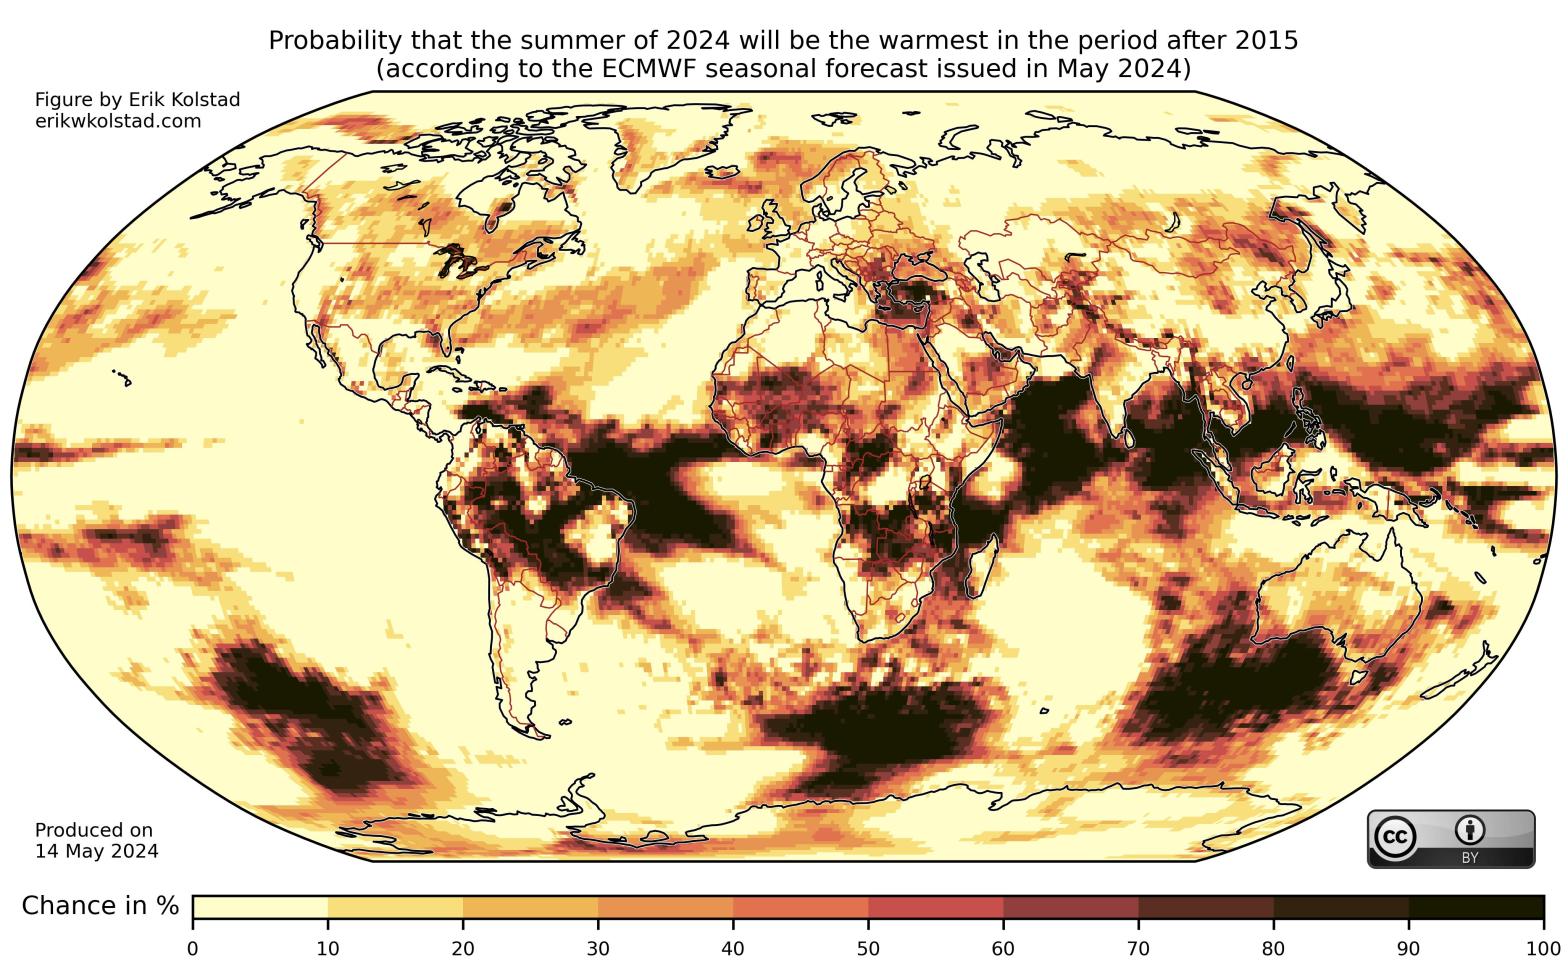
In Climate Futures, we’ve tried something new this year. Rather than comparing the seasonal predictions for the boreal summer to a normal period – which seems to be a very abstract concept to most people – we’ve compared it to the last nine years. When we include 2024, this gives us a nice 10-year periodFortsett å lese «Boreal Summer Predictions for 2024»
Kategoriarkiv: Climate maps
Annual cycle of East African rainfall
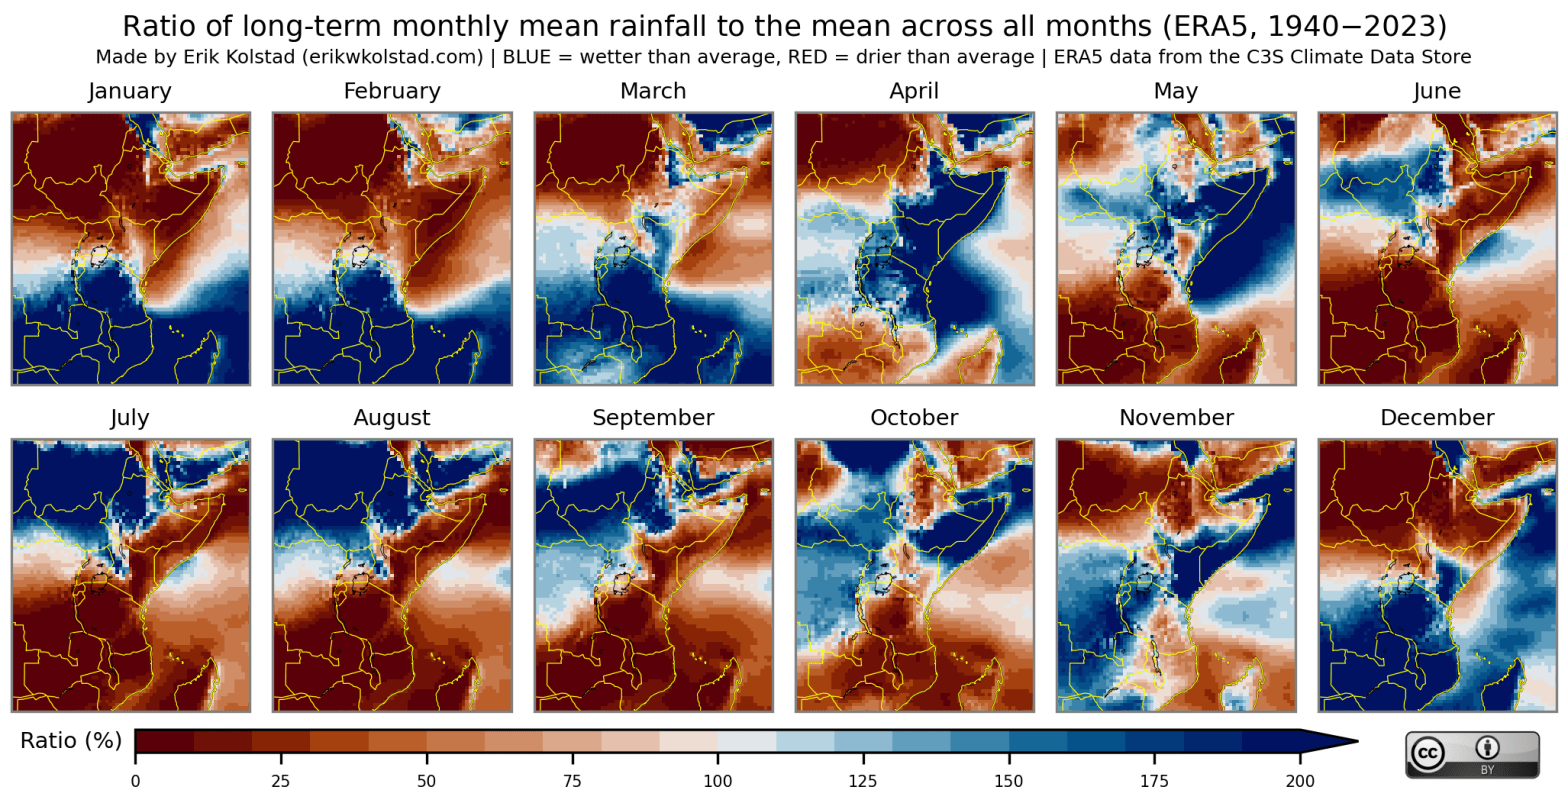
East Africa experiences several rainy seasons, depending on the geographical location. In the figure below, I have computed the long-term monthly mean rainfall for each month and divided this by the long-term monthly mean rainfall across all months. When the ratio is above 100% for a given month, it means that it rains more onFortsett å lese «Annual cycle of East African rainfall»
Global December 2023 temperatures ranked
Here’s a map that shows the overall rank of December 2023 amongst all the December months since 1960: Deep red, orange and yellow colours indicate places where December 2023 was amongst the three warmest years, but note that the other red colours also indicate that December 2023 was high on the list. I emphasise thatFortsett å lese «Global December 2023 temperatures ranked»
How warm was July 2023?
There were heat waves in Europe, China, North America, and even South America (during winter) in July 2023. Here’s a map that shows the overall rank of July 2023 amongst all the July months since 1960: Deep red, orange and yellow colours indicate places where July 2023 was amongst the three warmest years, but noteFortsett å lese «How warm was July 2023?»
An atlas of seasonal correlations between El Niño and La Niña and temperature and precipitation

A collection of maps that show the correlation between El Niño and La Niña and global temperature and precipitation for each possible three-month period, starting with January–March and ending with December–February
