Update on 20 May 2026: Added maps for sea level pressure, thanks to a suggestion by Scott Osprey About three years ago, I made some maps illustrating the global relationships between El Niño/La Niña and temperature and precipitation. These have turned out to be quite popular, so I updated them (and added maps for seaFortsett å lese «Updated maps of El Niño/La Niña effects on temperature, rainfall, and pressure»
Taggarkiv: la nina
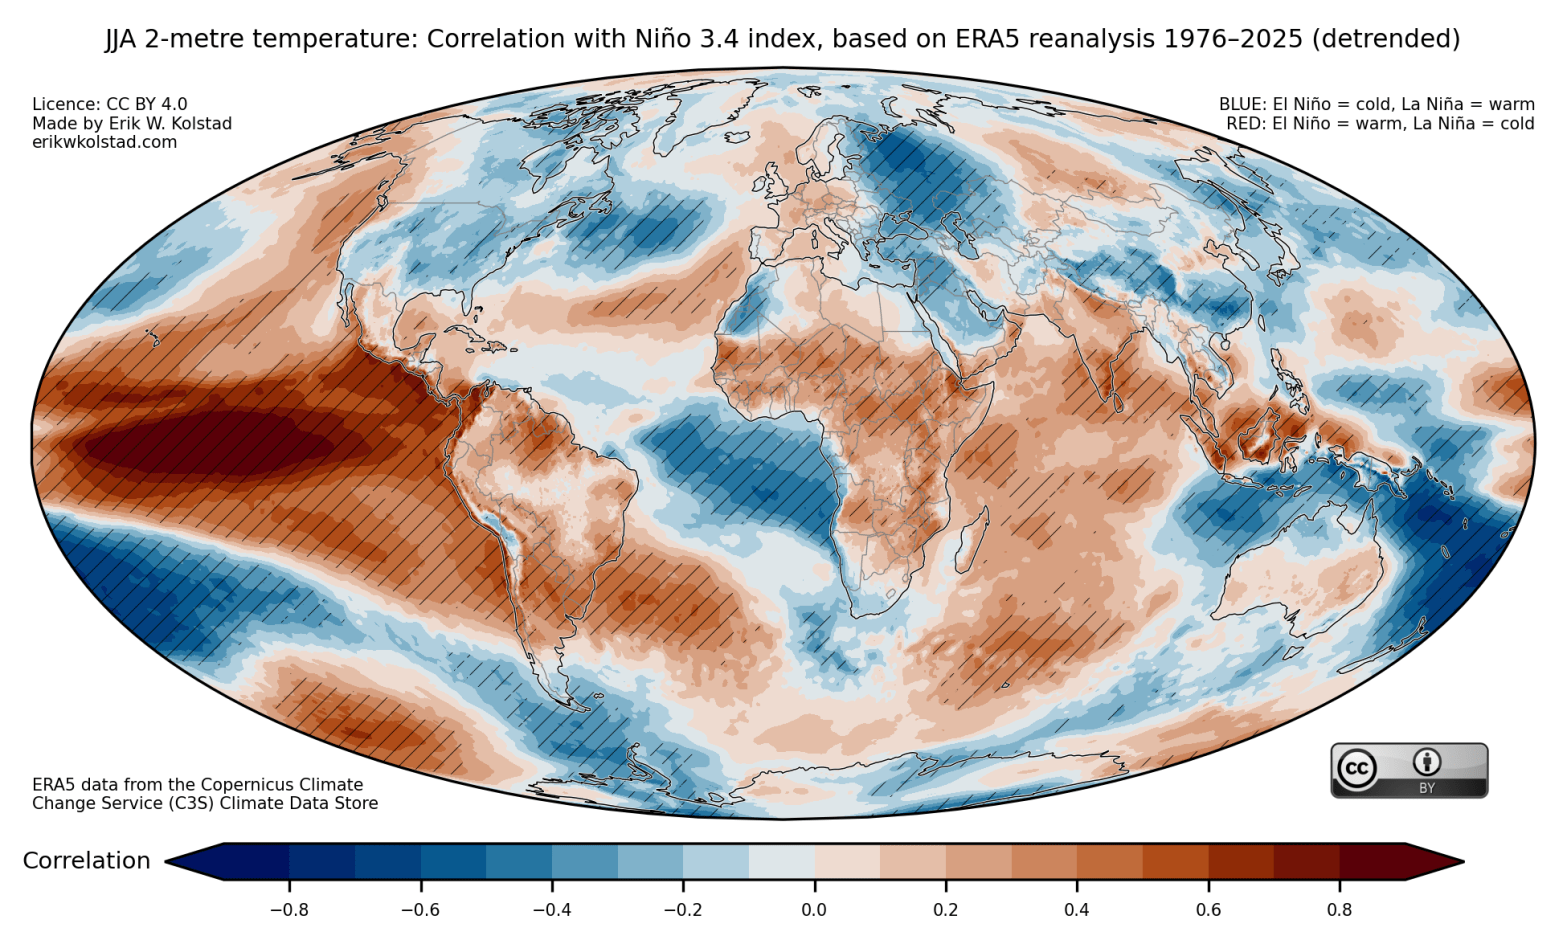
An atlas of seasonal correlations between El Niño and La Niña and temperature and precipitation

A collection of maps that show the correlation between El Niño and La Niña and global temperature and precipitation for each possible three-month period, starting with January–March and ending with December–February
ENSO precipitation maps

We will probably soon make our way out of an unusually long La Niña episode (2 years so far). During a La Niña spell, the ocean surface is colder than normal in a large part of the eastern tropical Pacific, starting off the coast of South America and stretching far out to the open ocean.Fortsett å lese «ENSO precipitation maps»
