Update on 20 May 2026: Added maps for sea level pressure, thanks to a suggestion by Scott Osprey About three years ago, I made some maps illustrating the global relationships between El Niño/La Niña and temperature and precipitation. These have turned out to be quite popular, so I updated them (and added maps for seaFortsett å lese «Updated maps of El Niño/La Niña effects on temperature, rainfall, and pressure»
Taggarkiv: weather
Annual cycle of East African rainfall
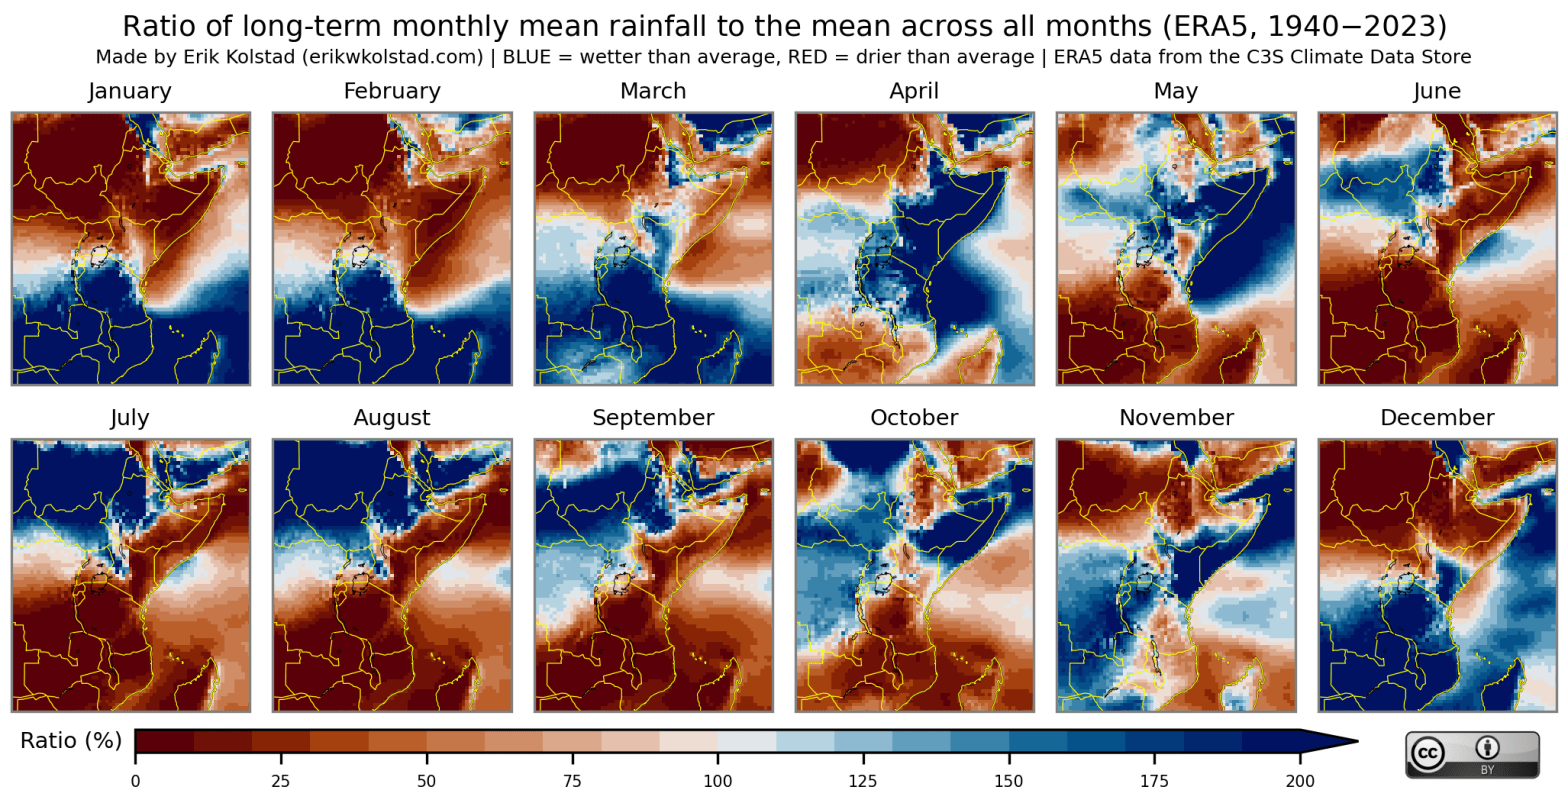
East Africa experiences several rainy seasons, depending on the geographical location. In the figure below, I have computed the long-term monthly mean rainfall for each month and divided this by the long-term monthly mean rainfall across all months. When the ratio is above 100% for a given month, it means that it rains more onFortsett å lese «Annual cycle of East African rainfall»
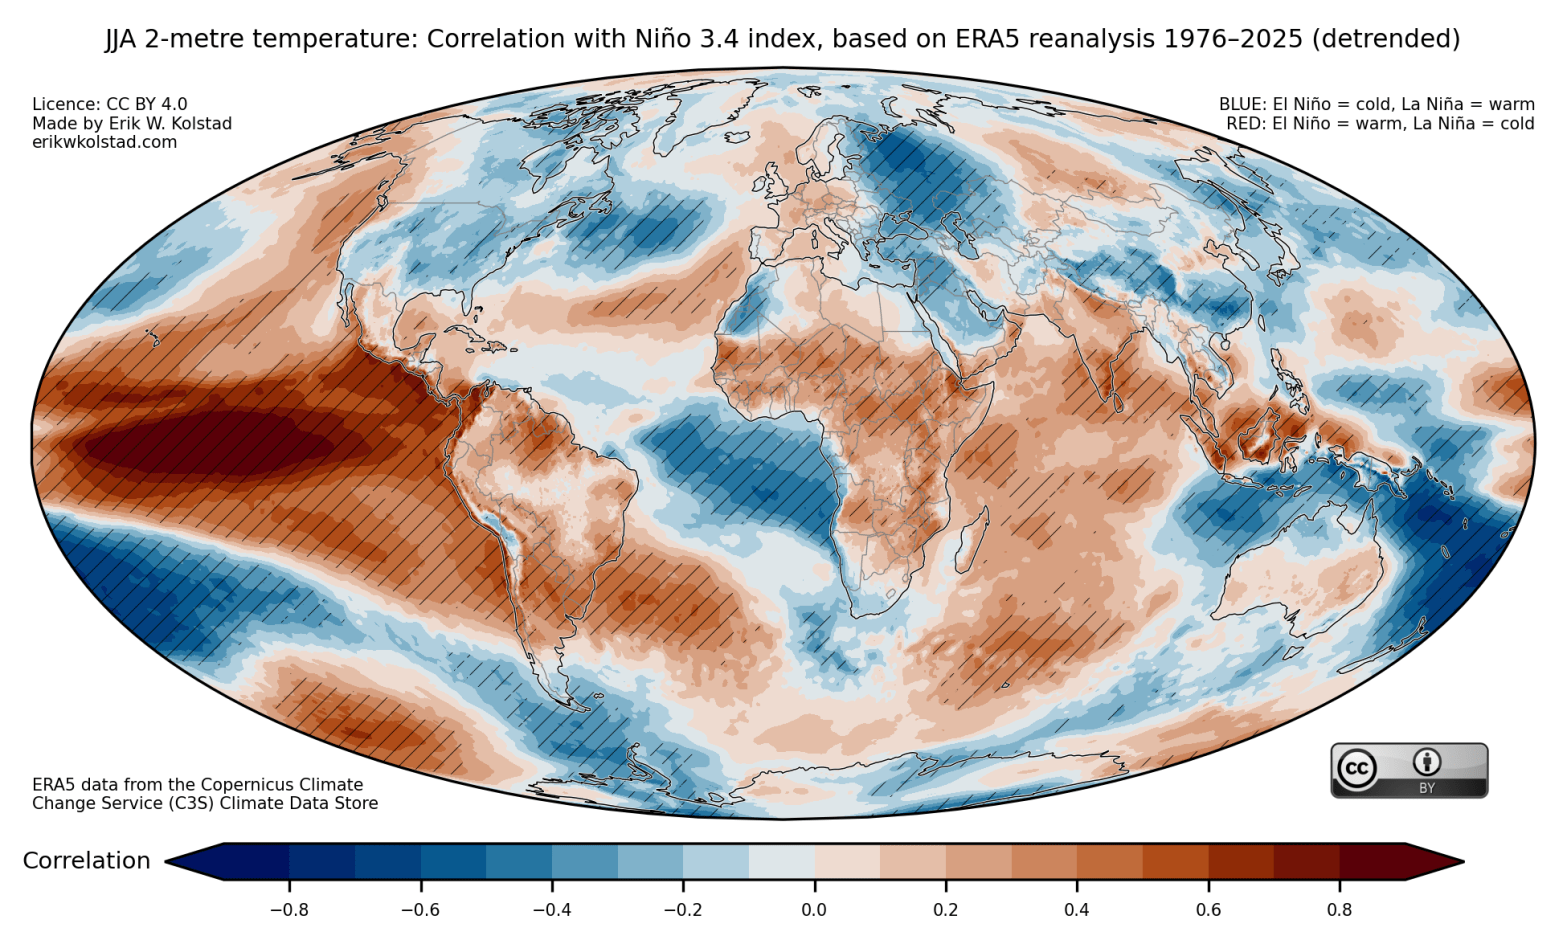
An atlas of seasonal correlations between El Niño and La Niña and temperature and precipitation

A collection of maps that show the correlation between El Niño and La Niña and global temperature and precipitation for each possible three-month period, starting with January–March and ending with December–February
