The changing face of El Niño impacts on European winters

In the scientific literature, the classic El Niño impact has been: cold winters in northern Europe. This is because it has traditionally been linked to the negative phase of the North Atlantic Oscillation (NAO). In such negative phases, northern Europe gets cold and dry weather, while mild and wet conditions are expected in southern Europe. The reason is that storms in the North Atlantic are shifted southwards and hit Continental Europe instead of Norway.

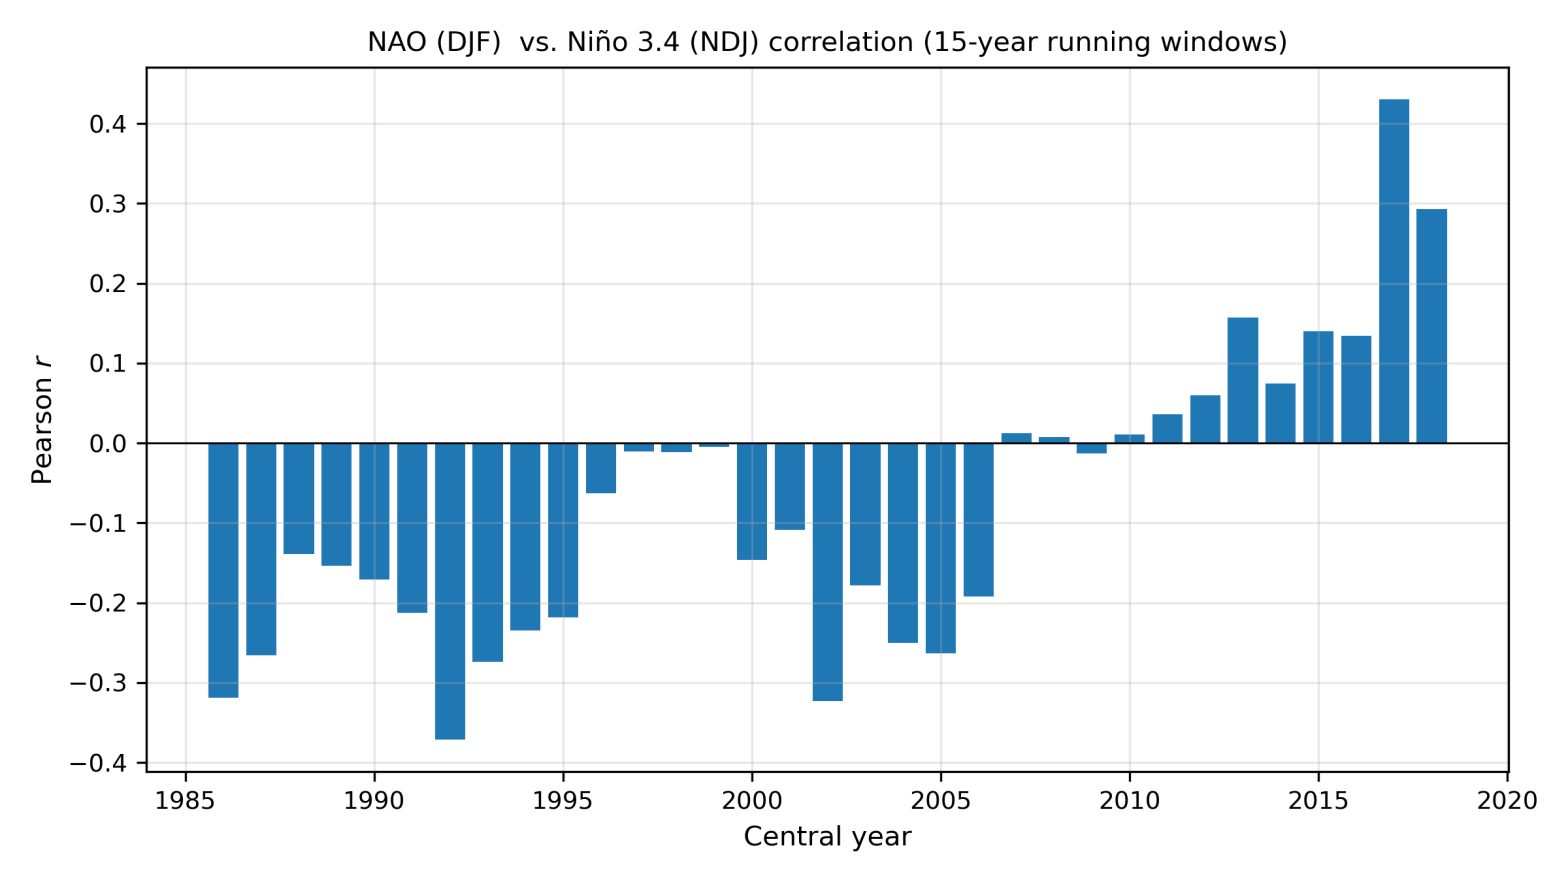
The graph below shows the correlation between an index representing the NAO in winter (December–February) and another index. This one, which is evaluated slightly before (November–January), to allow time for effects to propagate from the tropics to the mid-latitudes, is called Niño 3.4, and it is positive during El Niño and negative during La Niña. The correlations are shown for 15-year long, overlapping windows.
Correlation between the NAO index in winter (December to February) and the Niño 3.4 index one month before (November to January), calculated using ERA5 reanalysis data. The NAO was defined here as the first EOF in the North Atlantic region (90W–40E, 20N–80N) of sea-level pressure from 1979 to 2026. The Niño 3.4 index was computed as the mean sea-surface temperature (SST) between 5S and 5N, and between 170W and 120W, after subtracting the long-term linear trend of the mean SST between 60S and 60N.

It is immediately clear that the correlation has changed over the years. Of most relevance to us now is that the correlation has been positive in recent years, whereas it was negative or neutral for a long time, up to the 15-year period centred on 2010. You may have seen lot of posts or articles warning us about a cold winter because of El Niño, but these forecasts may be based on a correlation that simply doesn’t exist anymore.

Last winter the NAO was distinctly negative, and this occurred during La Niña conditions. This fits with the “new” correlations, but not with the “old” ones.

A caveat is that the correlation has been weak in all the periods; its maximum is slightly above 0.4, which is quite low. In other words, there could be something going on with the current El Niño that makes negative NAO conditions more likely, despite the positive correlation in recent decades. The latest seasonal forecasts do in fact indicate an increased likelihood of a negative NAO this winter, as shown in the picture below. The red colours around Greenland and the blue colours further south in the North Atlantic are typical of negative NAO conditions.
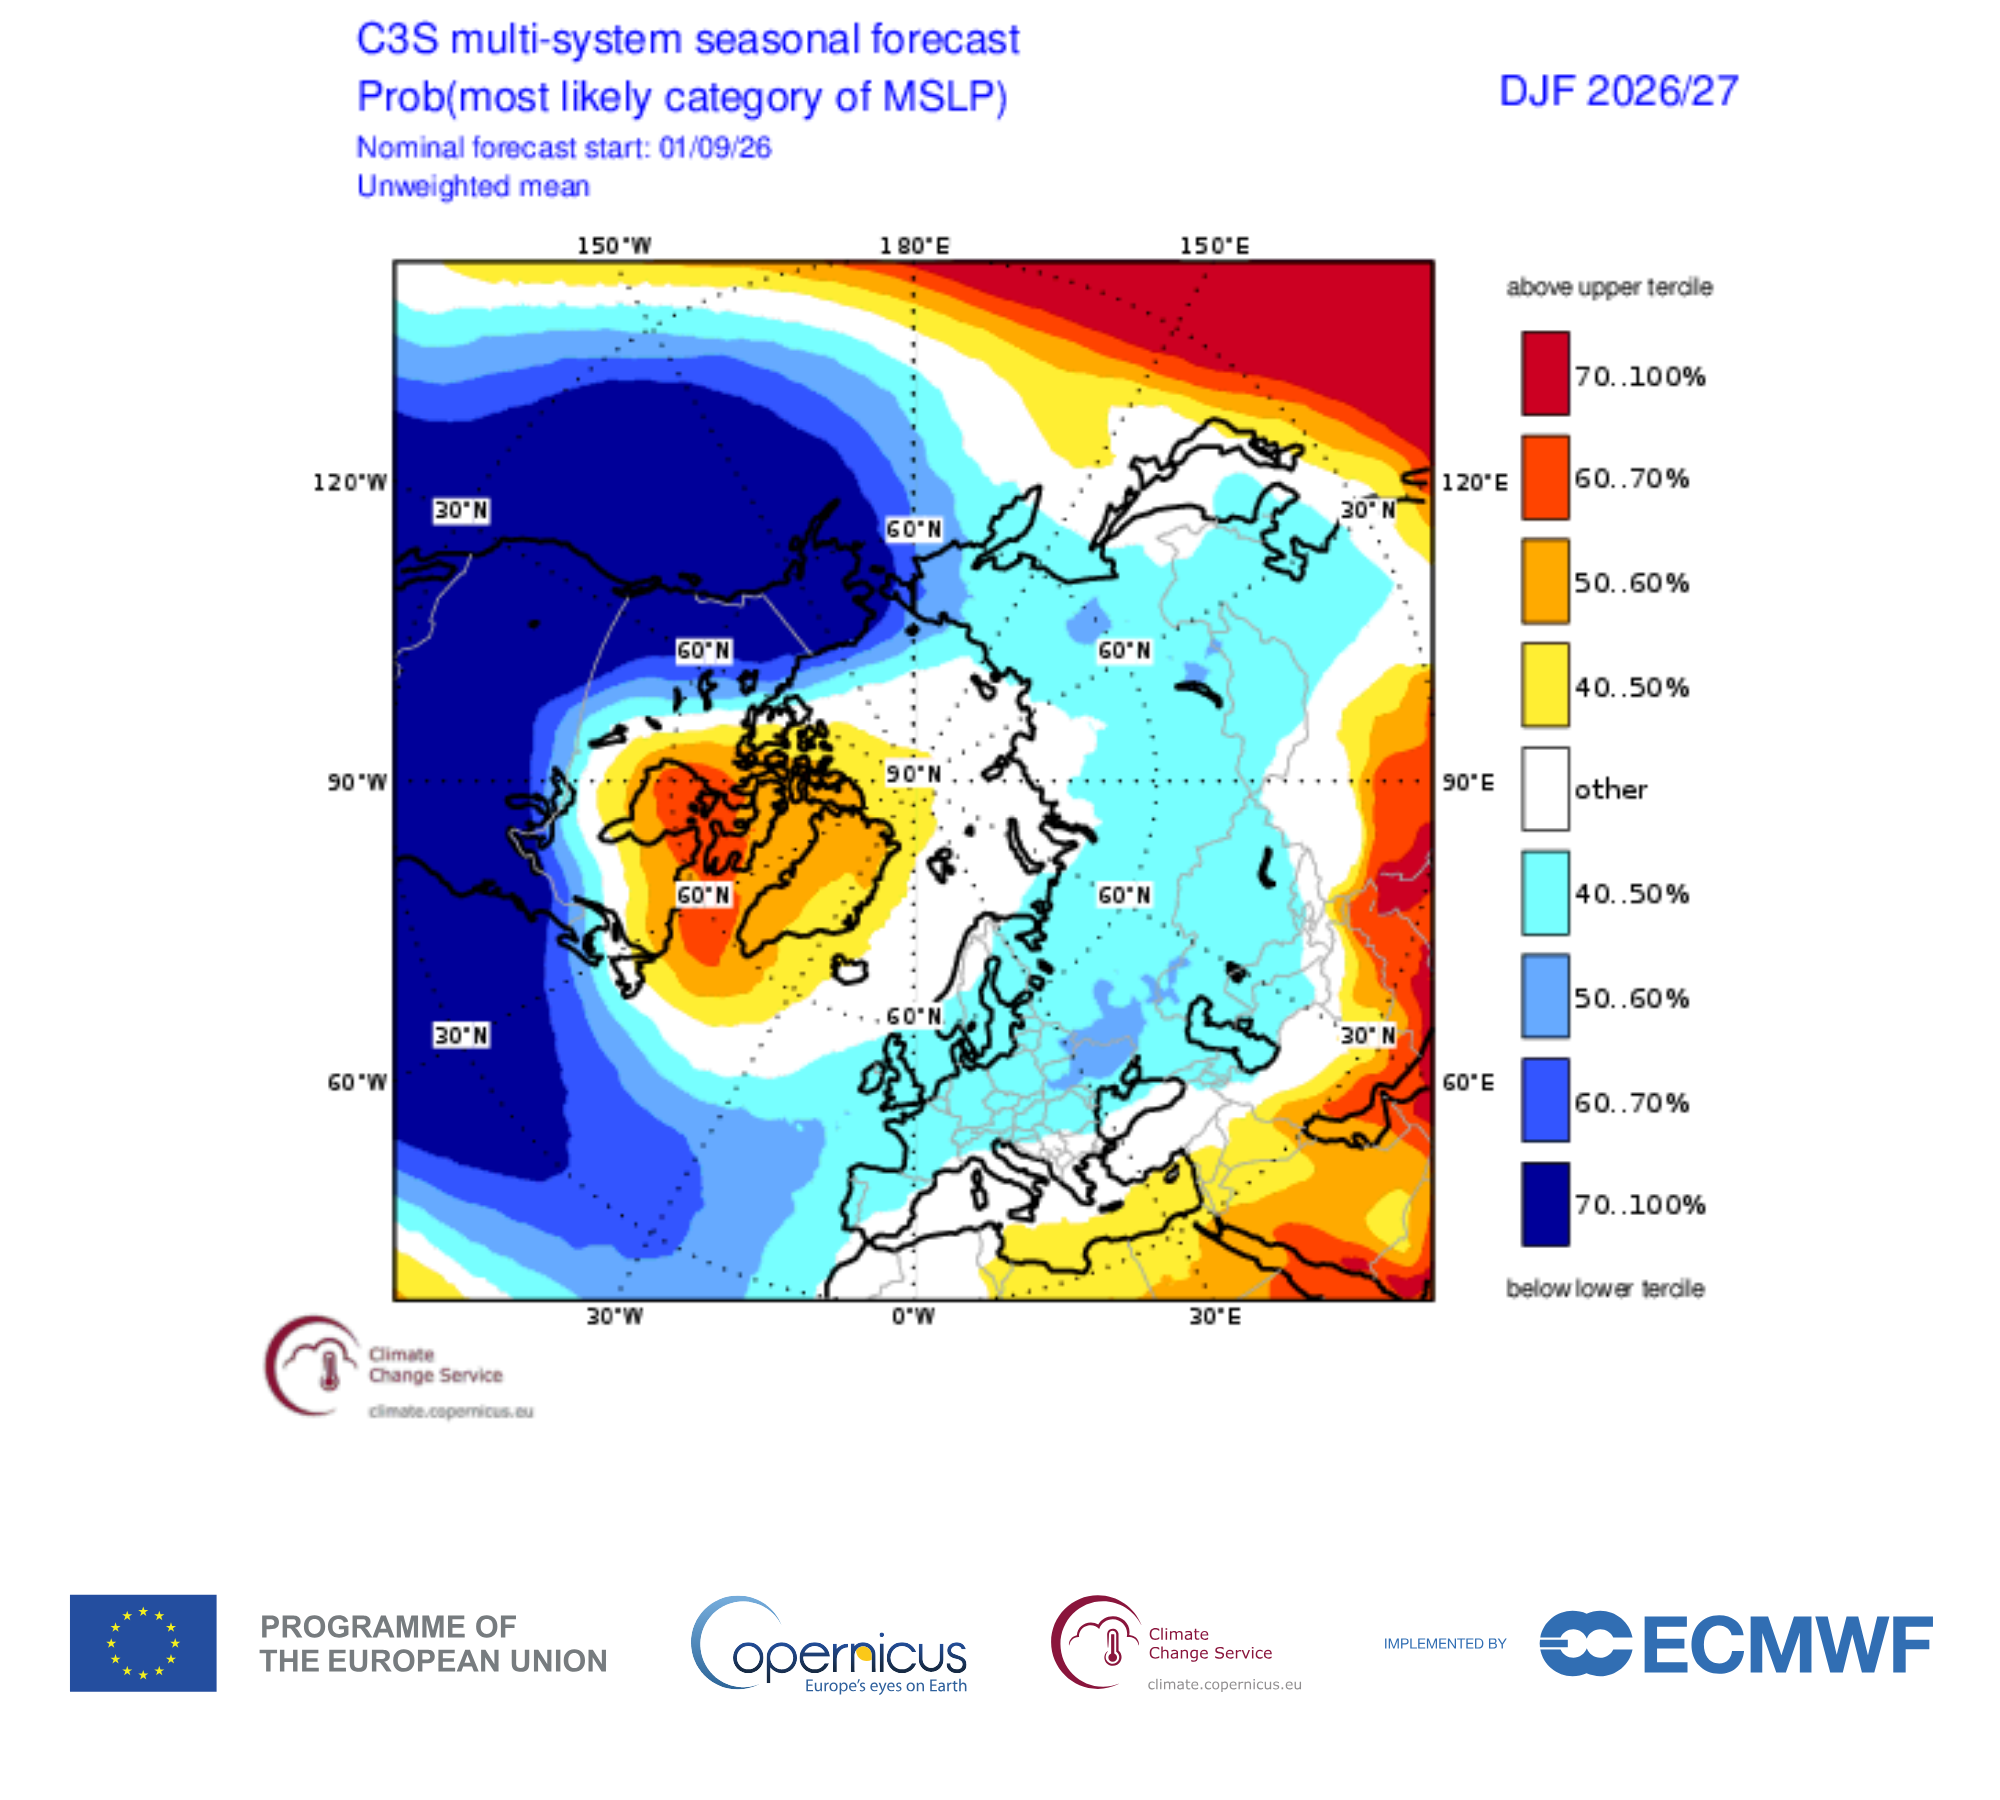
Multi-model seasonal forecast compiled by the Copernicus Climate Change Service (C3S) for the coming winter (December to February). Details can be found here.

It will be interesting to take stock after the winter and see whether El Niño played a significant role.

Will El Niño make the coming months wetter in western Europe?

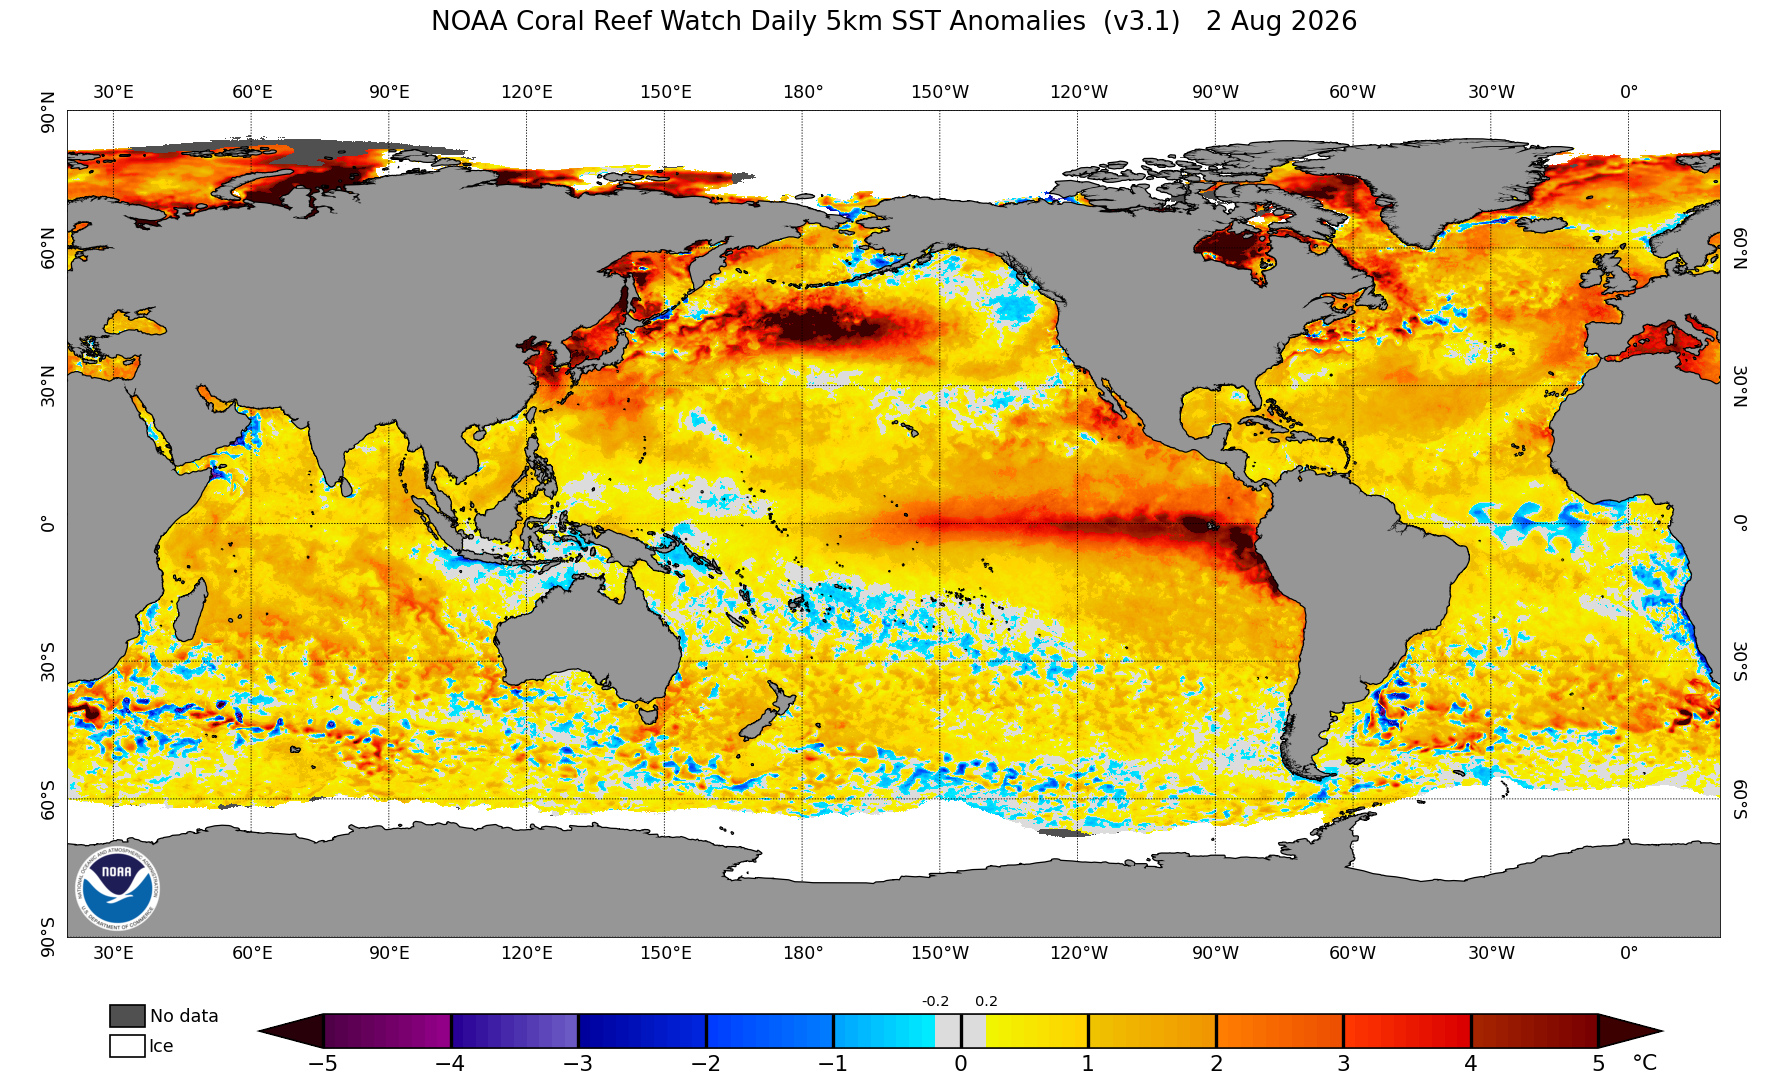
The ongoing El Niño episode is already strong now at the beginning of August, 2026. Here’s a picture of the current sea surface temperature (SST) anomalies:

SST anomalies on 2 August, 2026. Image from NOAA.

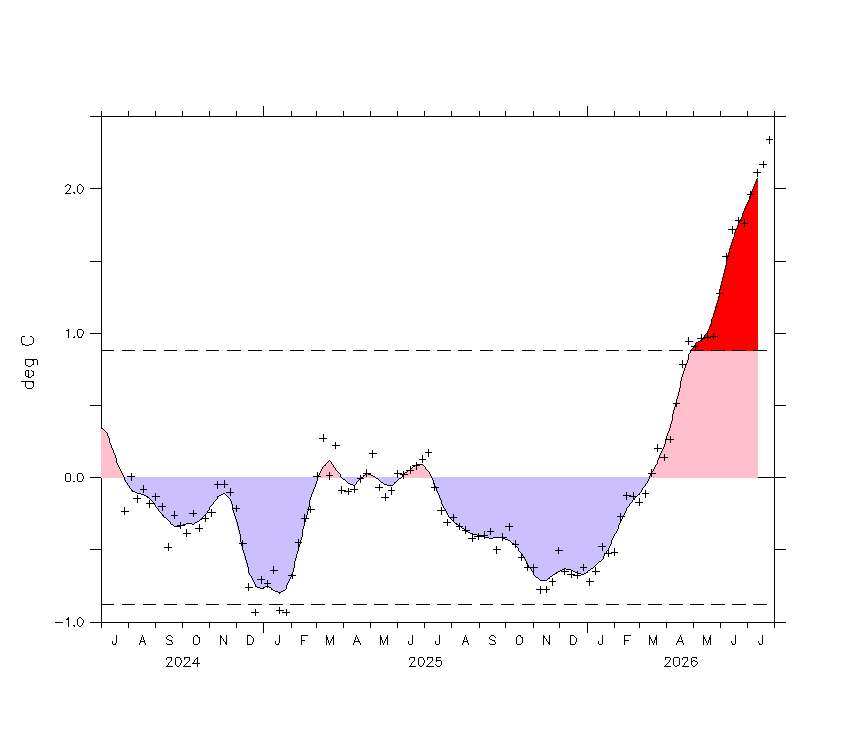
To gauge the strength of El Niño or La Niña, we use a time series based on the SST anomalies in the eastern Equatorial Pacific. The most widely used indicator is the Niño 3.4 index. The graph below shows the recent evolution of this index. It’s clearly gaining in strength going into the boreal autumn (El Niño usually peaks in boreal winter).

Time series of the Niño 3.4 index, from NOAA (accessed 4 August 2026). Crosses show weekly averages, and the shading shows monthly averages.

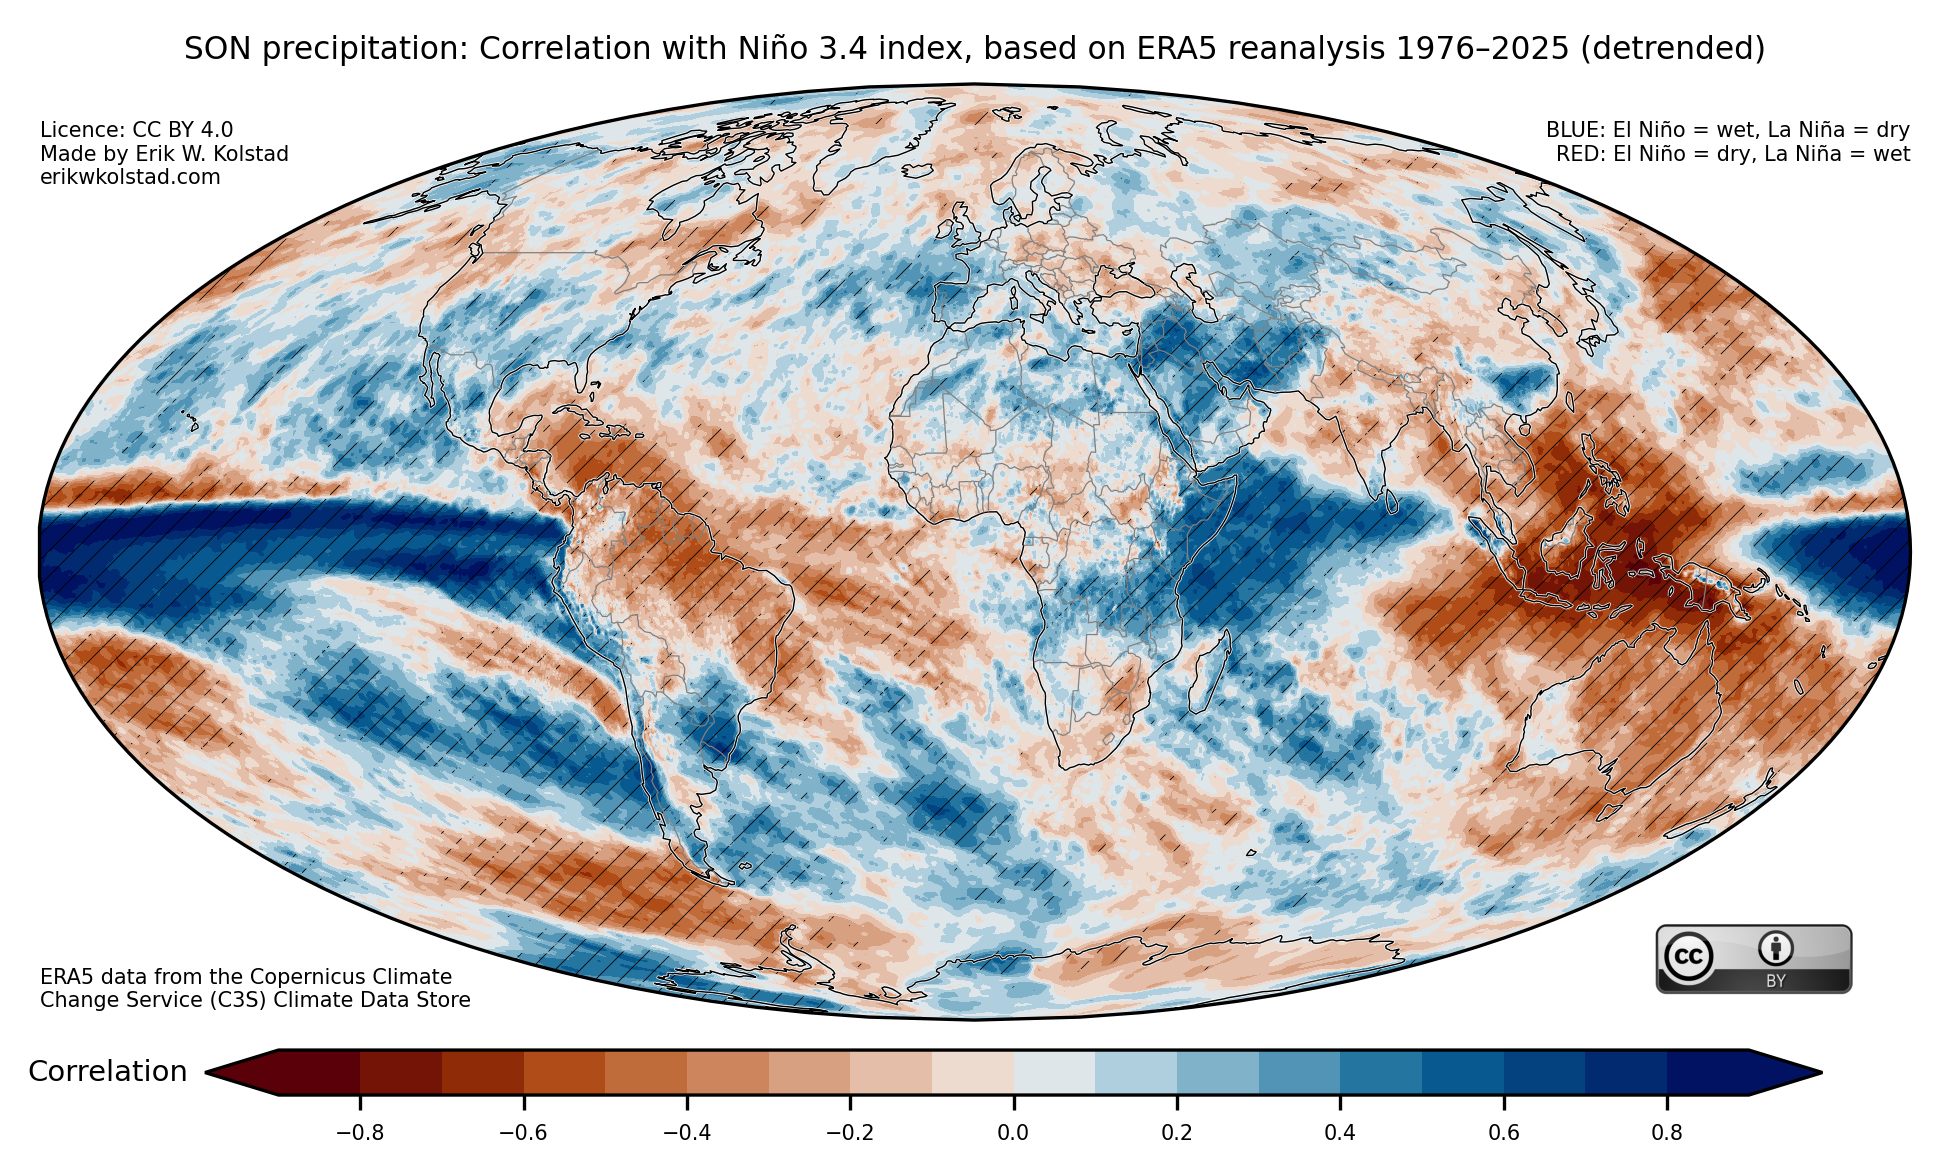
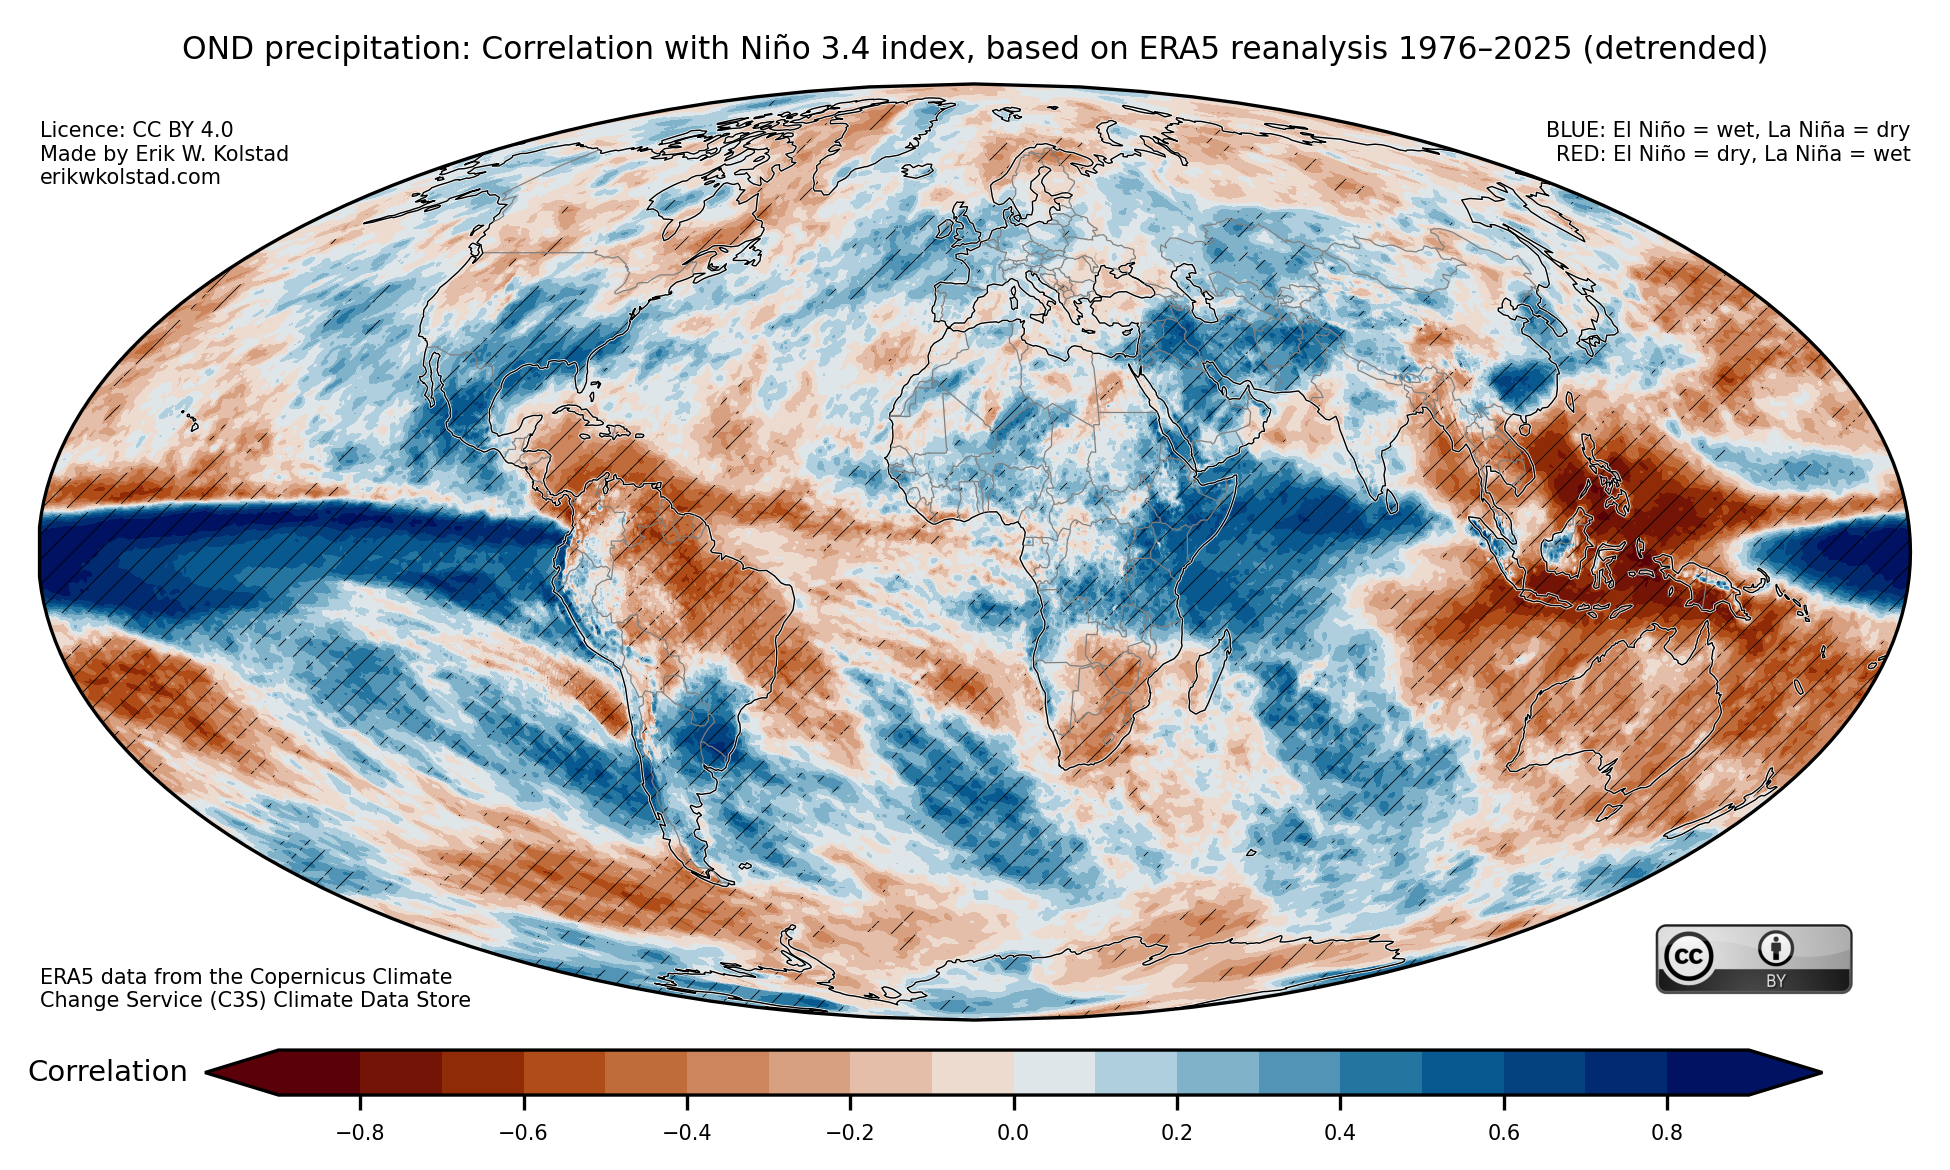
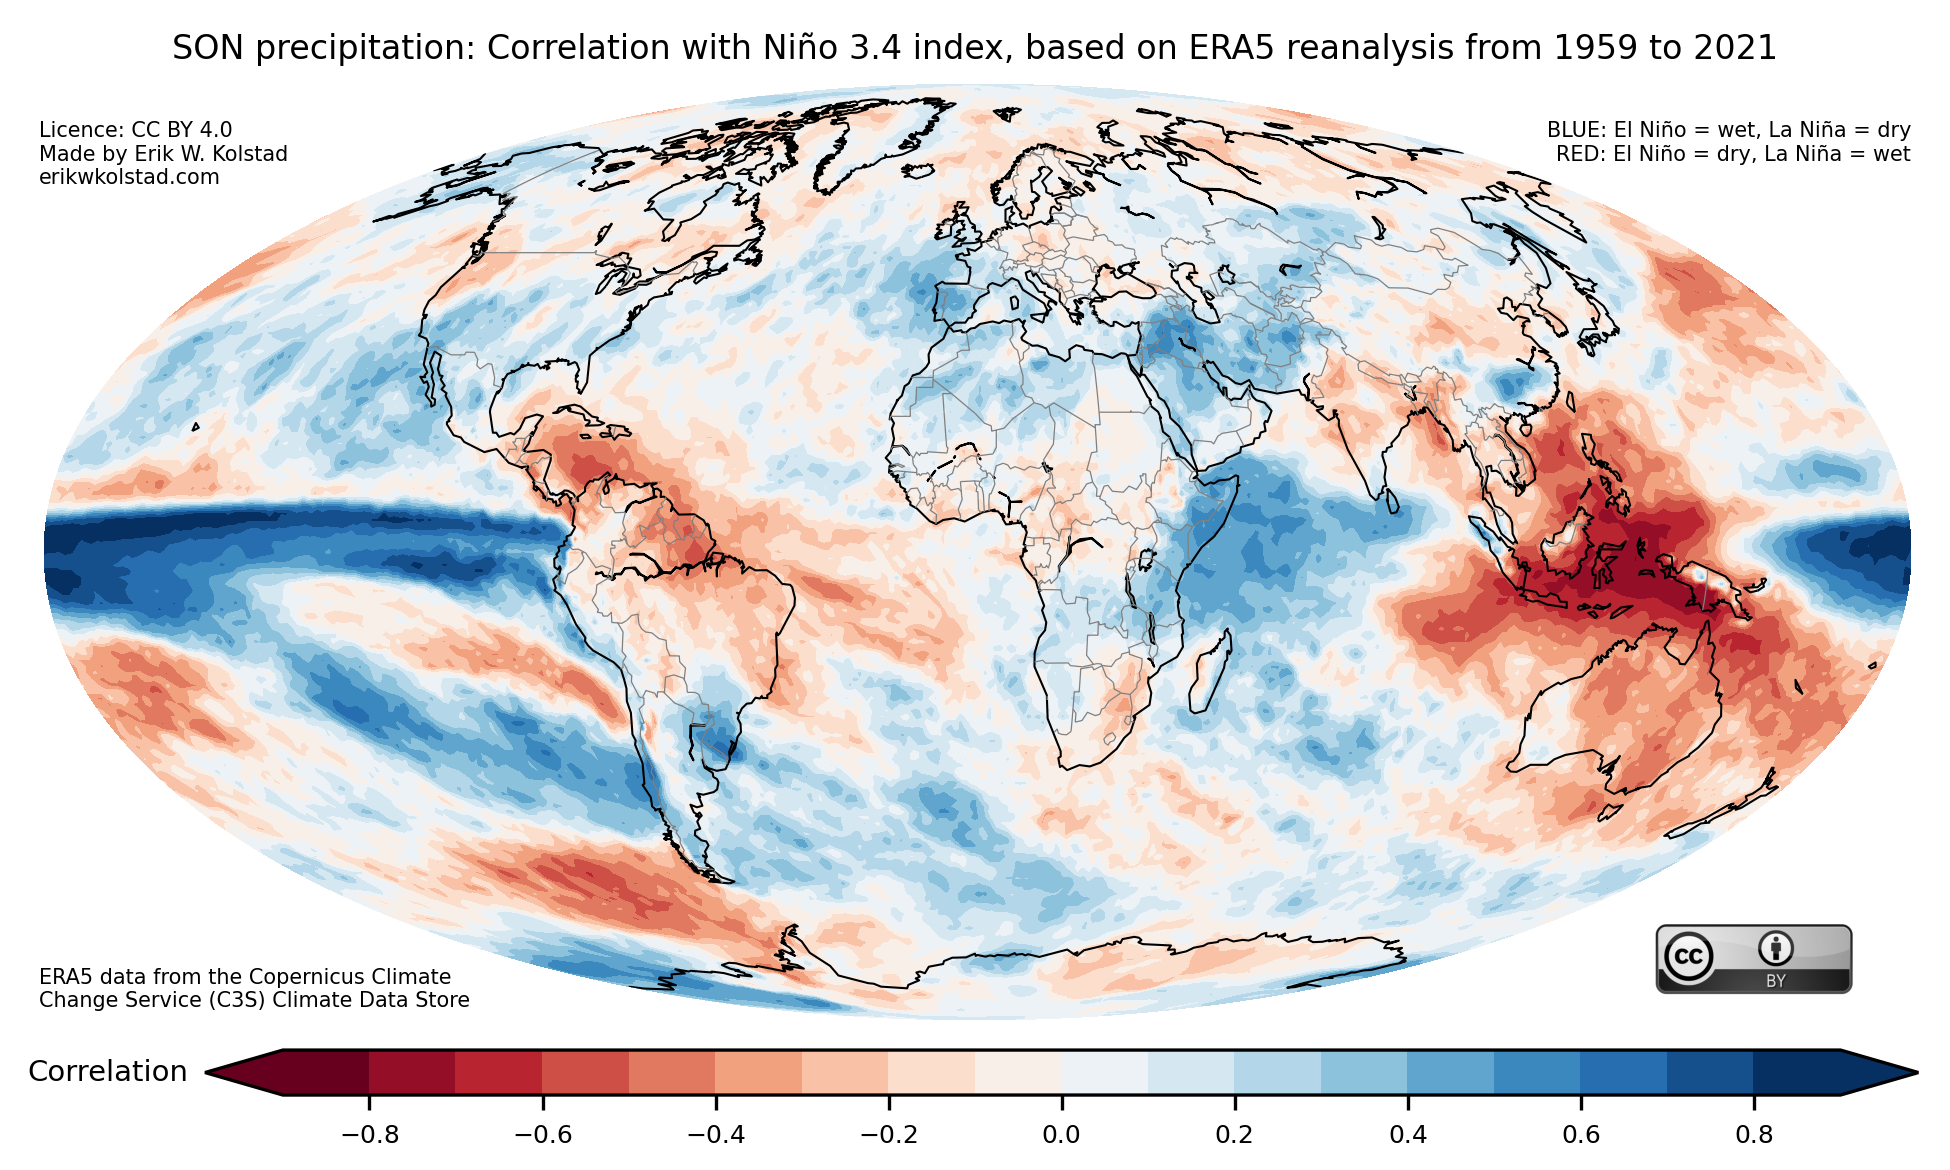
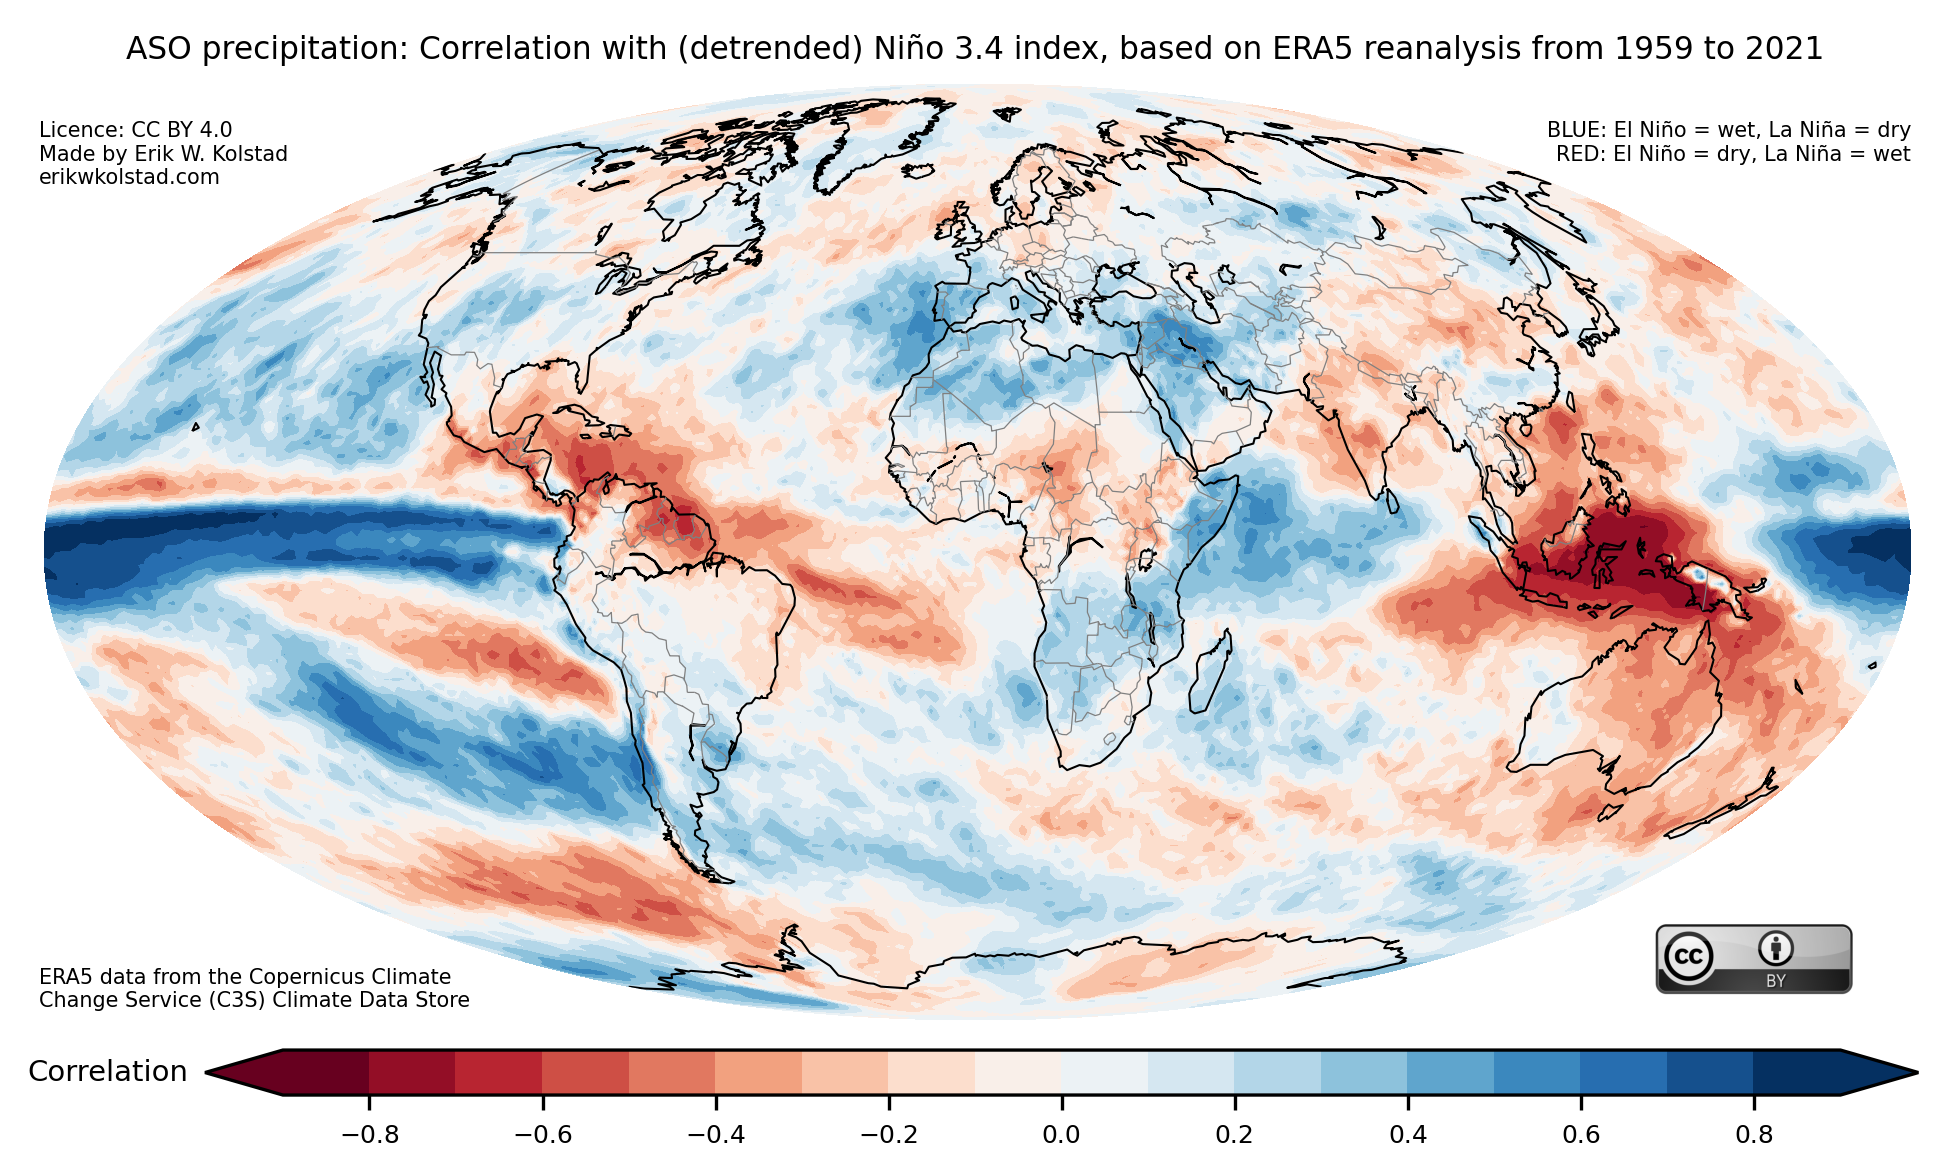
I’ve previously posted a series of pictures that show the correlation between the Niño 3.4 index and global precipitation. Here’s the map for boreal autumn (September to November):

Correlation between the detrended Niño 3.4 index and detrended precipitation anomalies for September–November, based on ERA5 reanalysis data for the period 1976–2025 (see more details here).

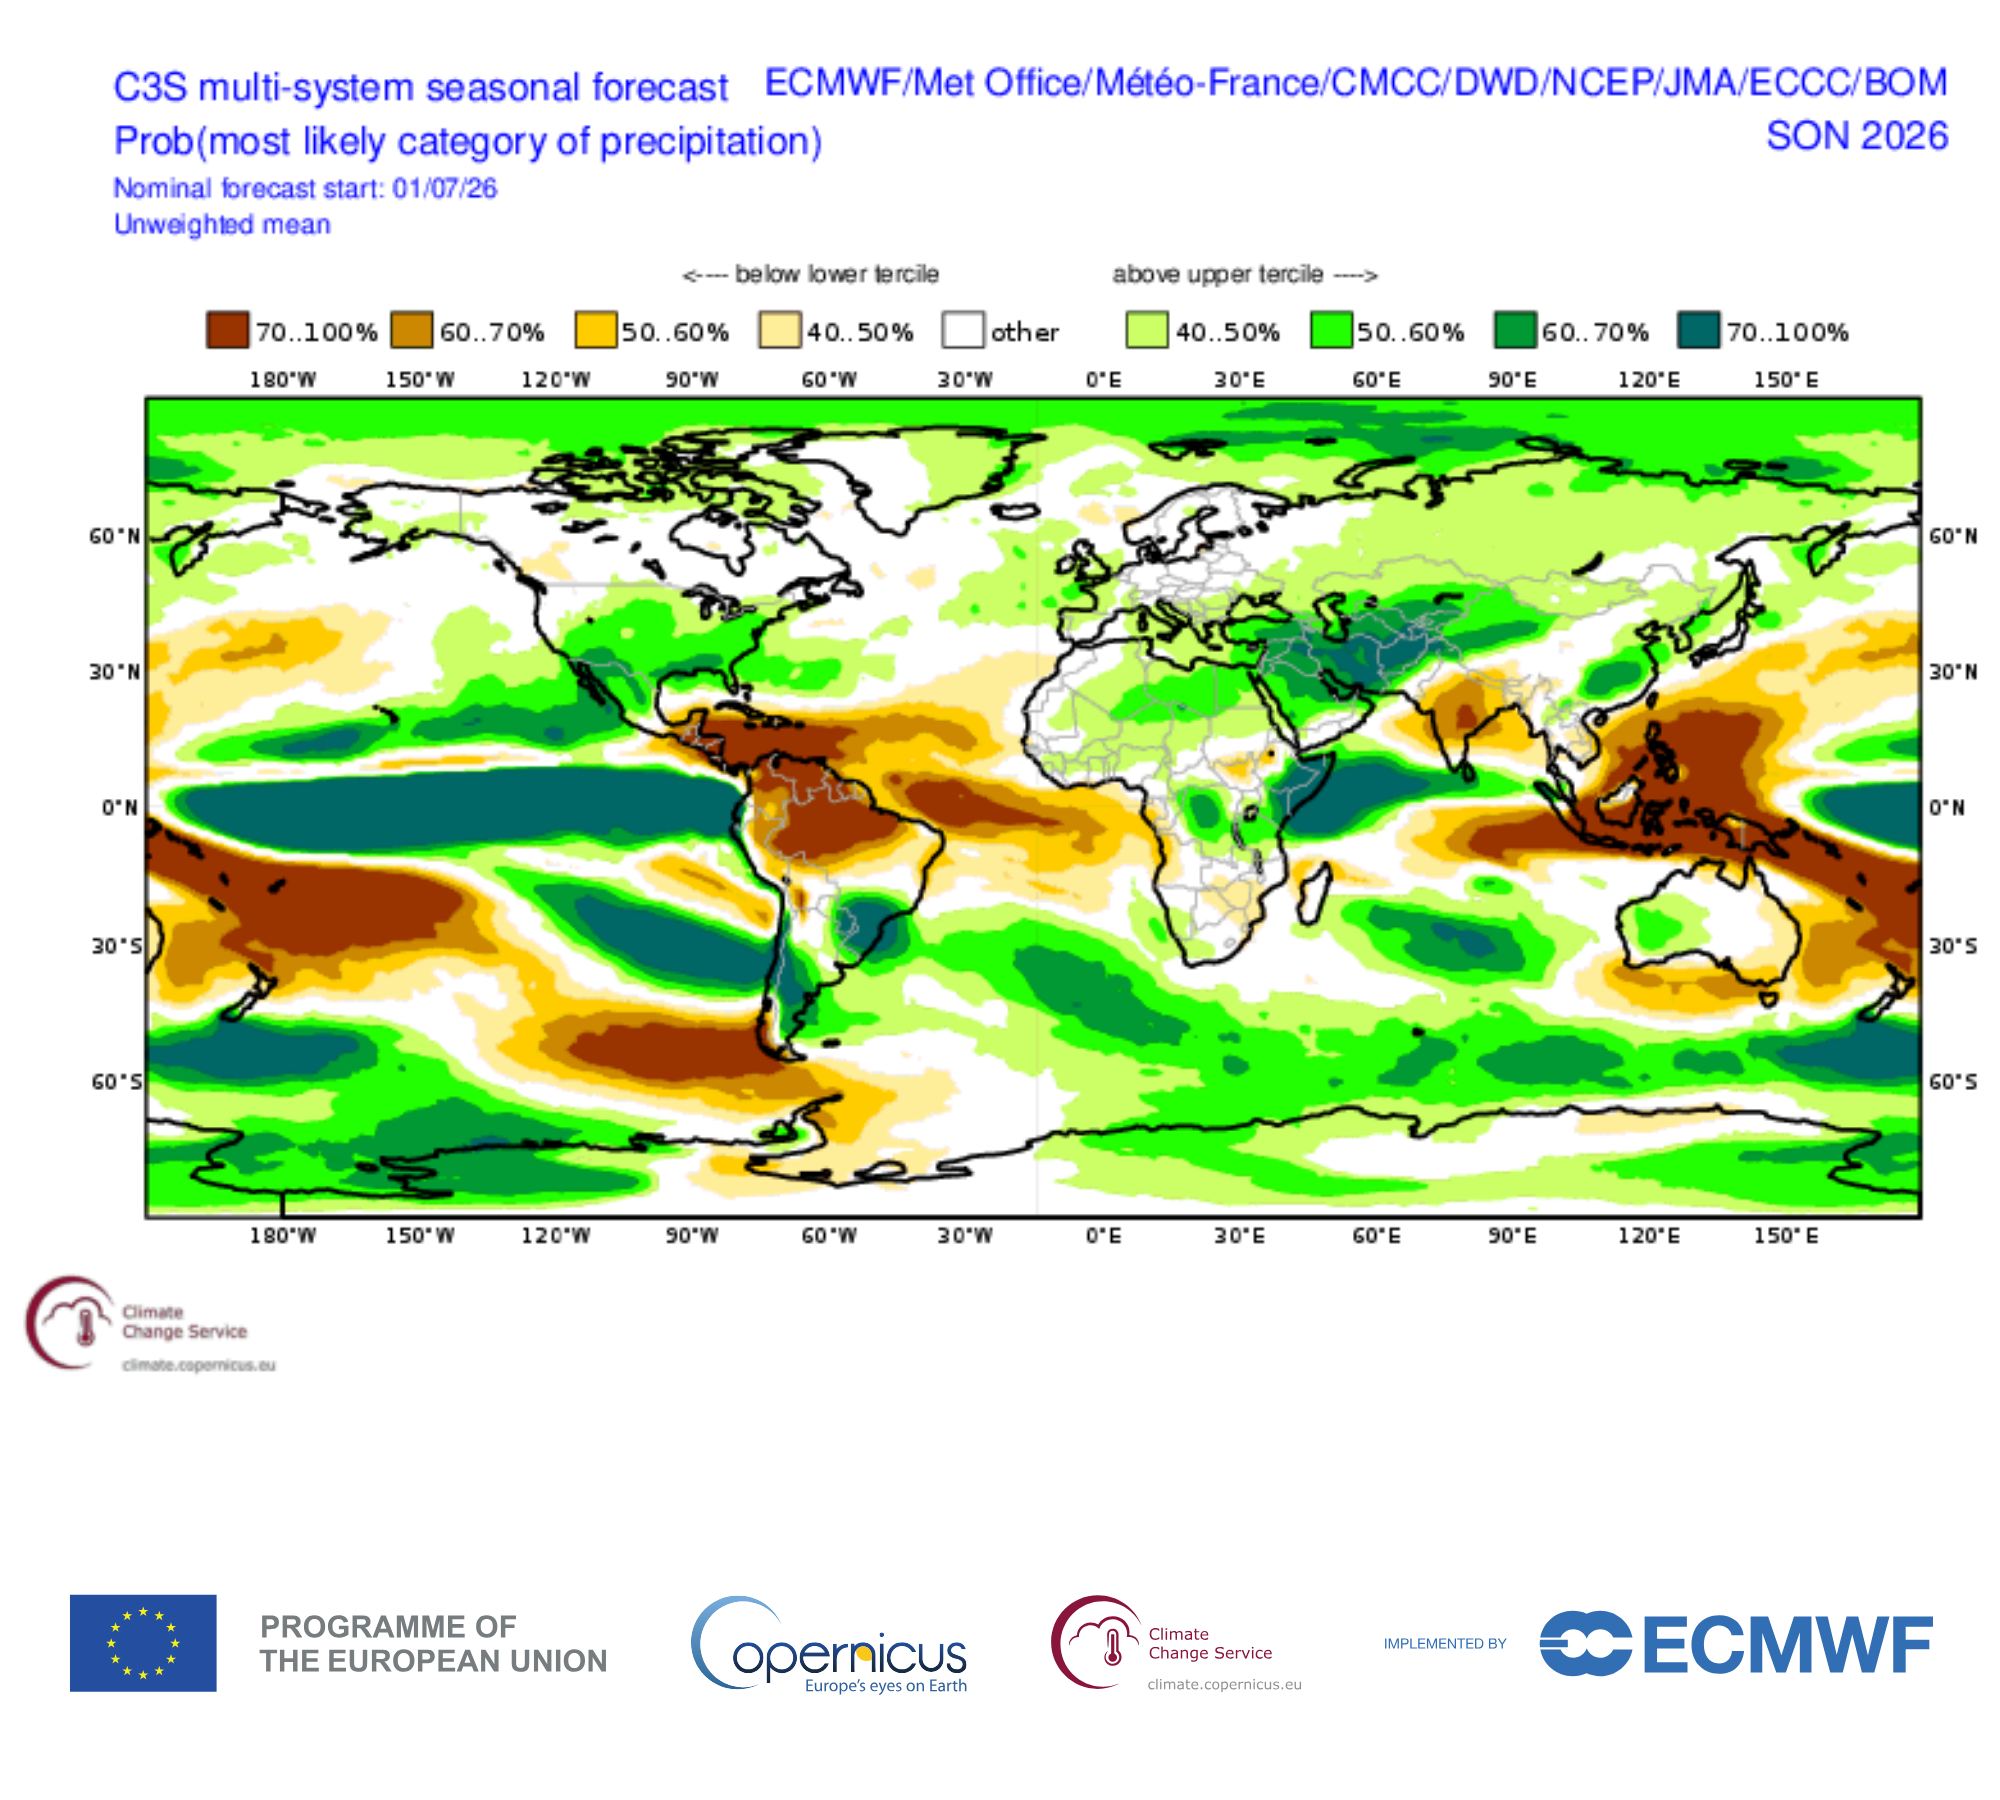
Looking at the multi-model seasonal precipitation forecasts collected by the Copernicus Climate Change Service (C3S) below, they are broadly similar. If the forecasts turn out to be right, the global precipitation this autumn will be dominated by the current El Niño. However, Beverly et al. (2023) showed that the seasonal forecast exhibit systematic biases – leading to forecast errors – when they are initialised during El Niño episodes, like now.

Copernicus C3S multi-model tercile probability forecast for September–November 2026, based on July simulations with 8 models. Colours indicate regions where the probability of below-normal (shades of red) or above-normal (shades of green) precipitation exceeds 40% relative to the model climatology.

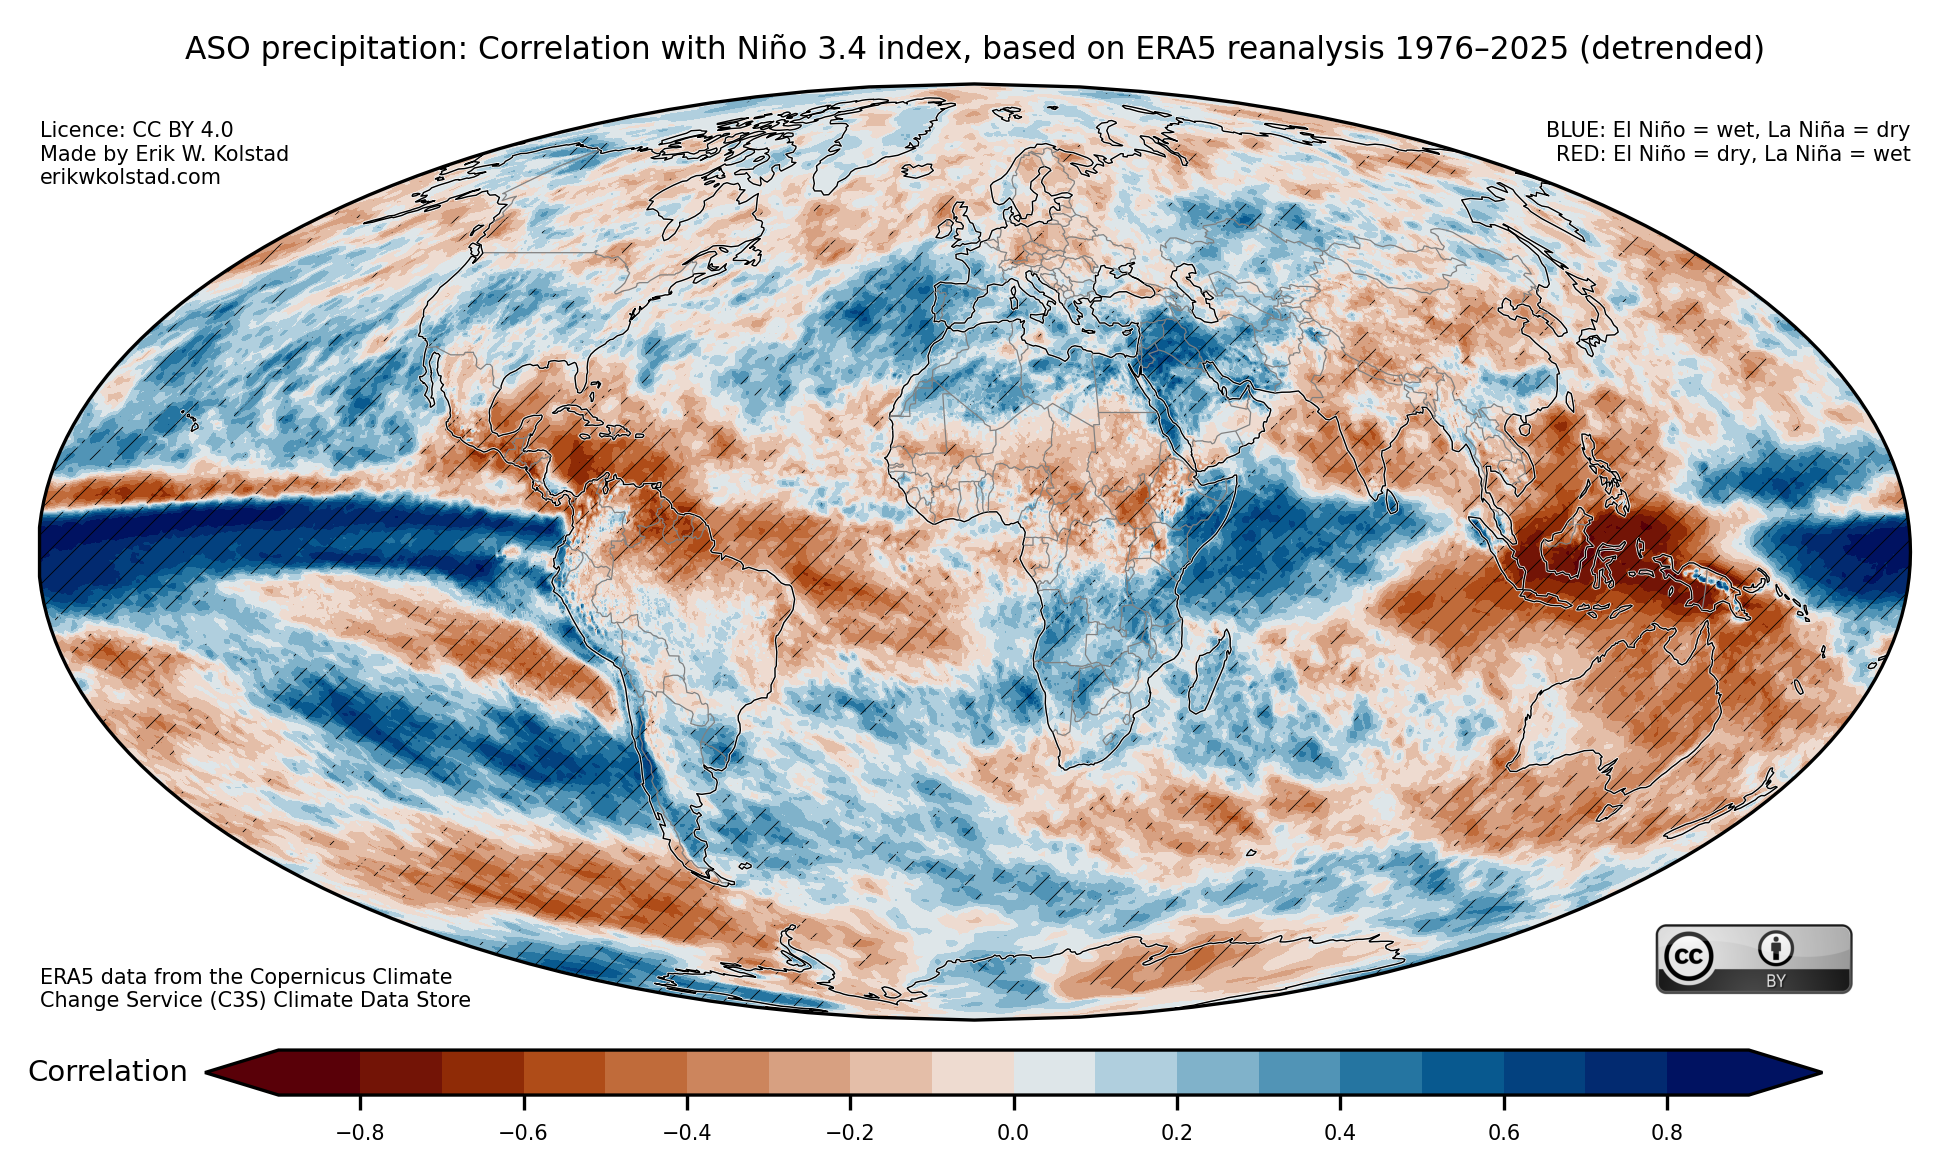
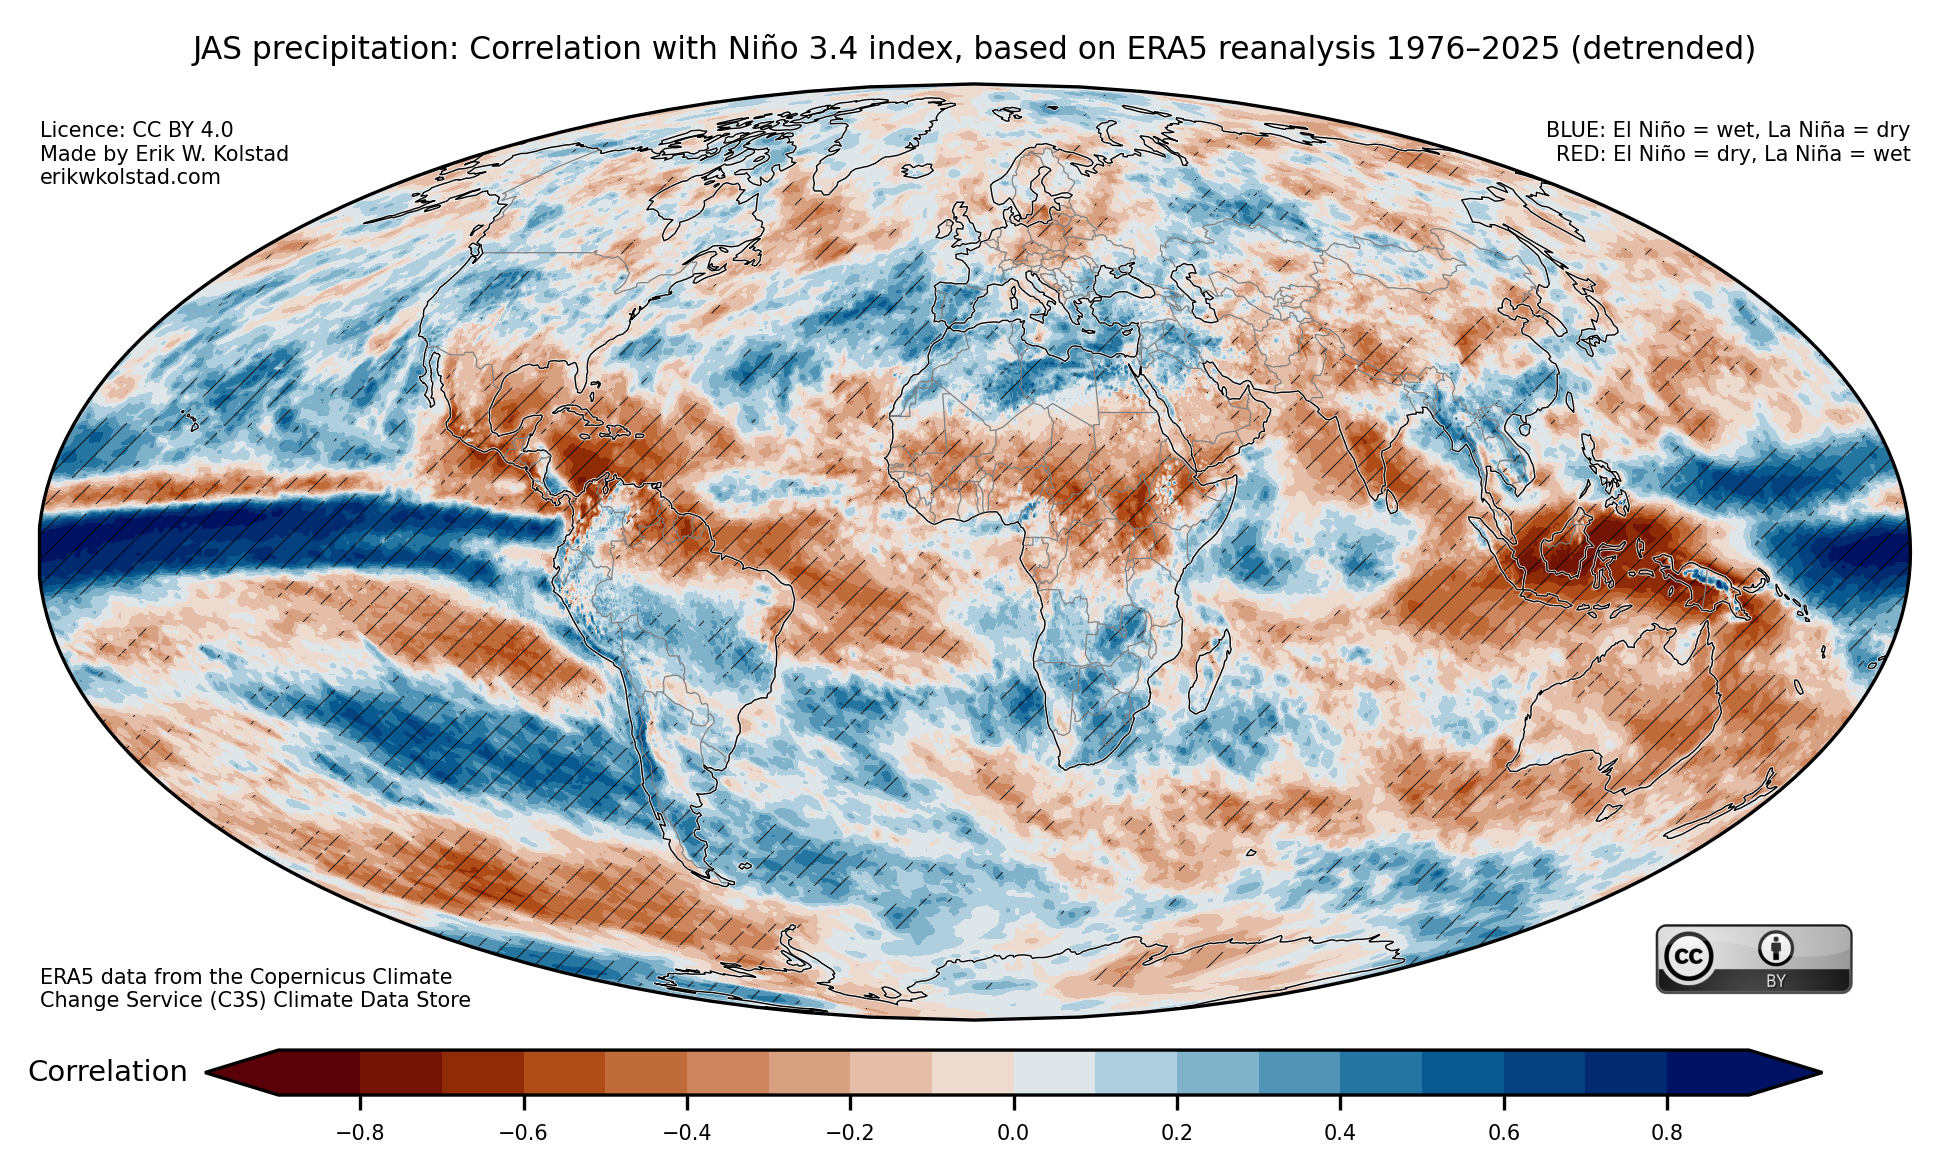
Still, for western Europeans, both the forecasts and the historical El Niño record yield hope that there may be relief on the way in the form of wetter weather. This is also the case for the more immediate three-month period from August to October:

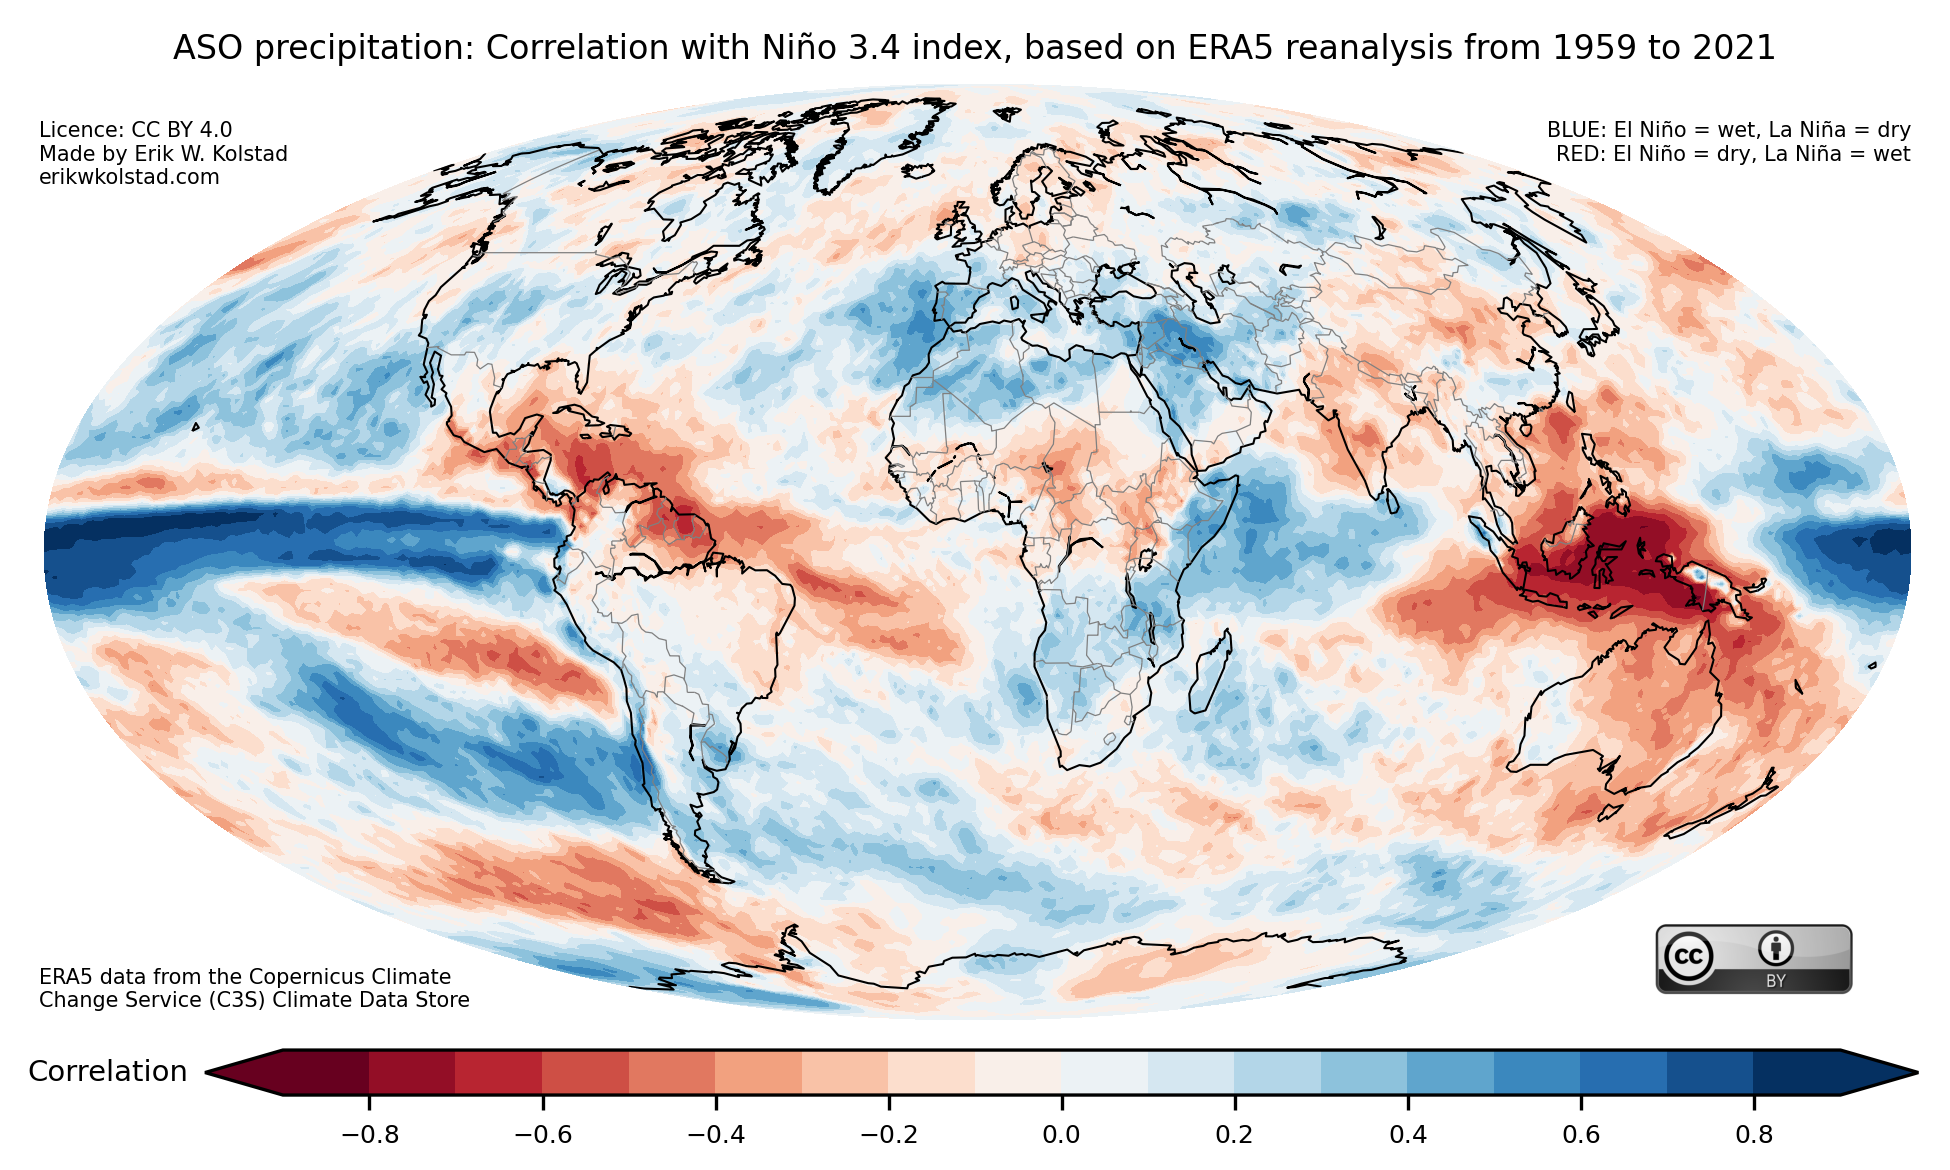
Correlation between the detrended Niño 3.4 index and detrended precipitation anomalies for August–October, based on ERA5 reanalysis data for the period 1976–2025 (see more details here).

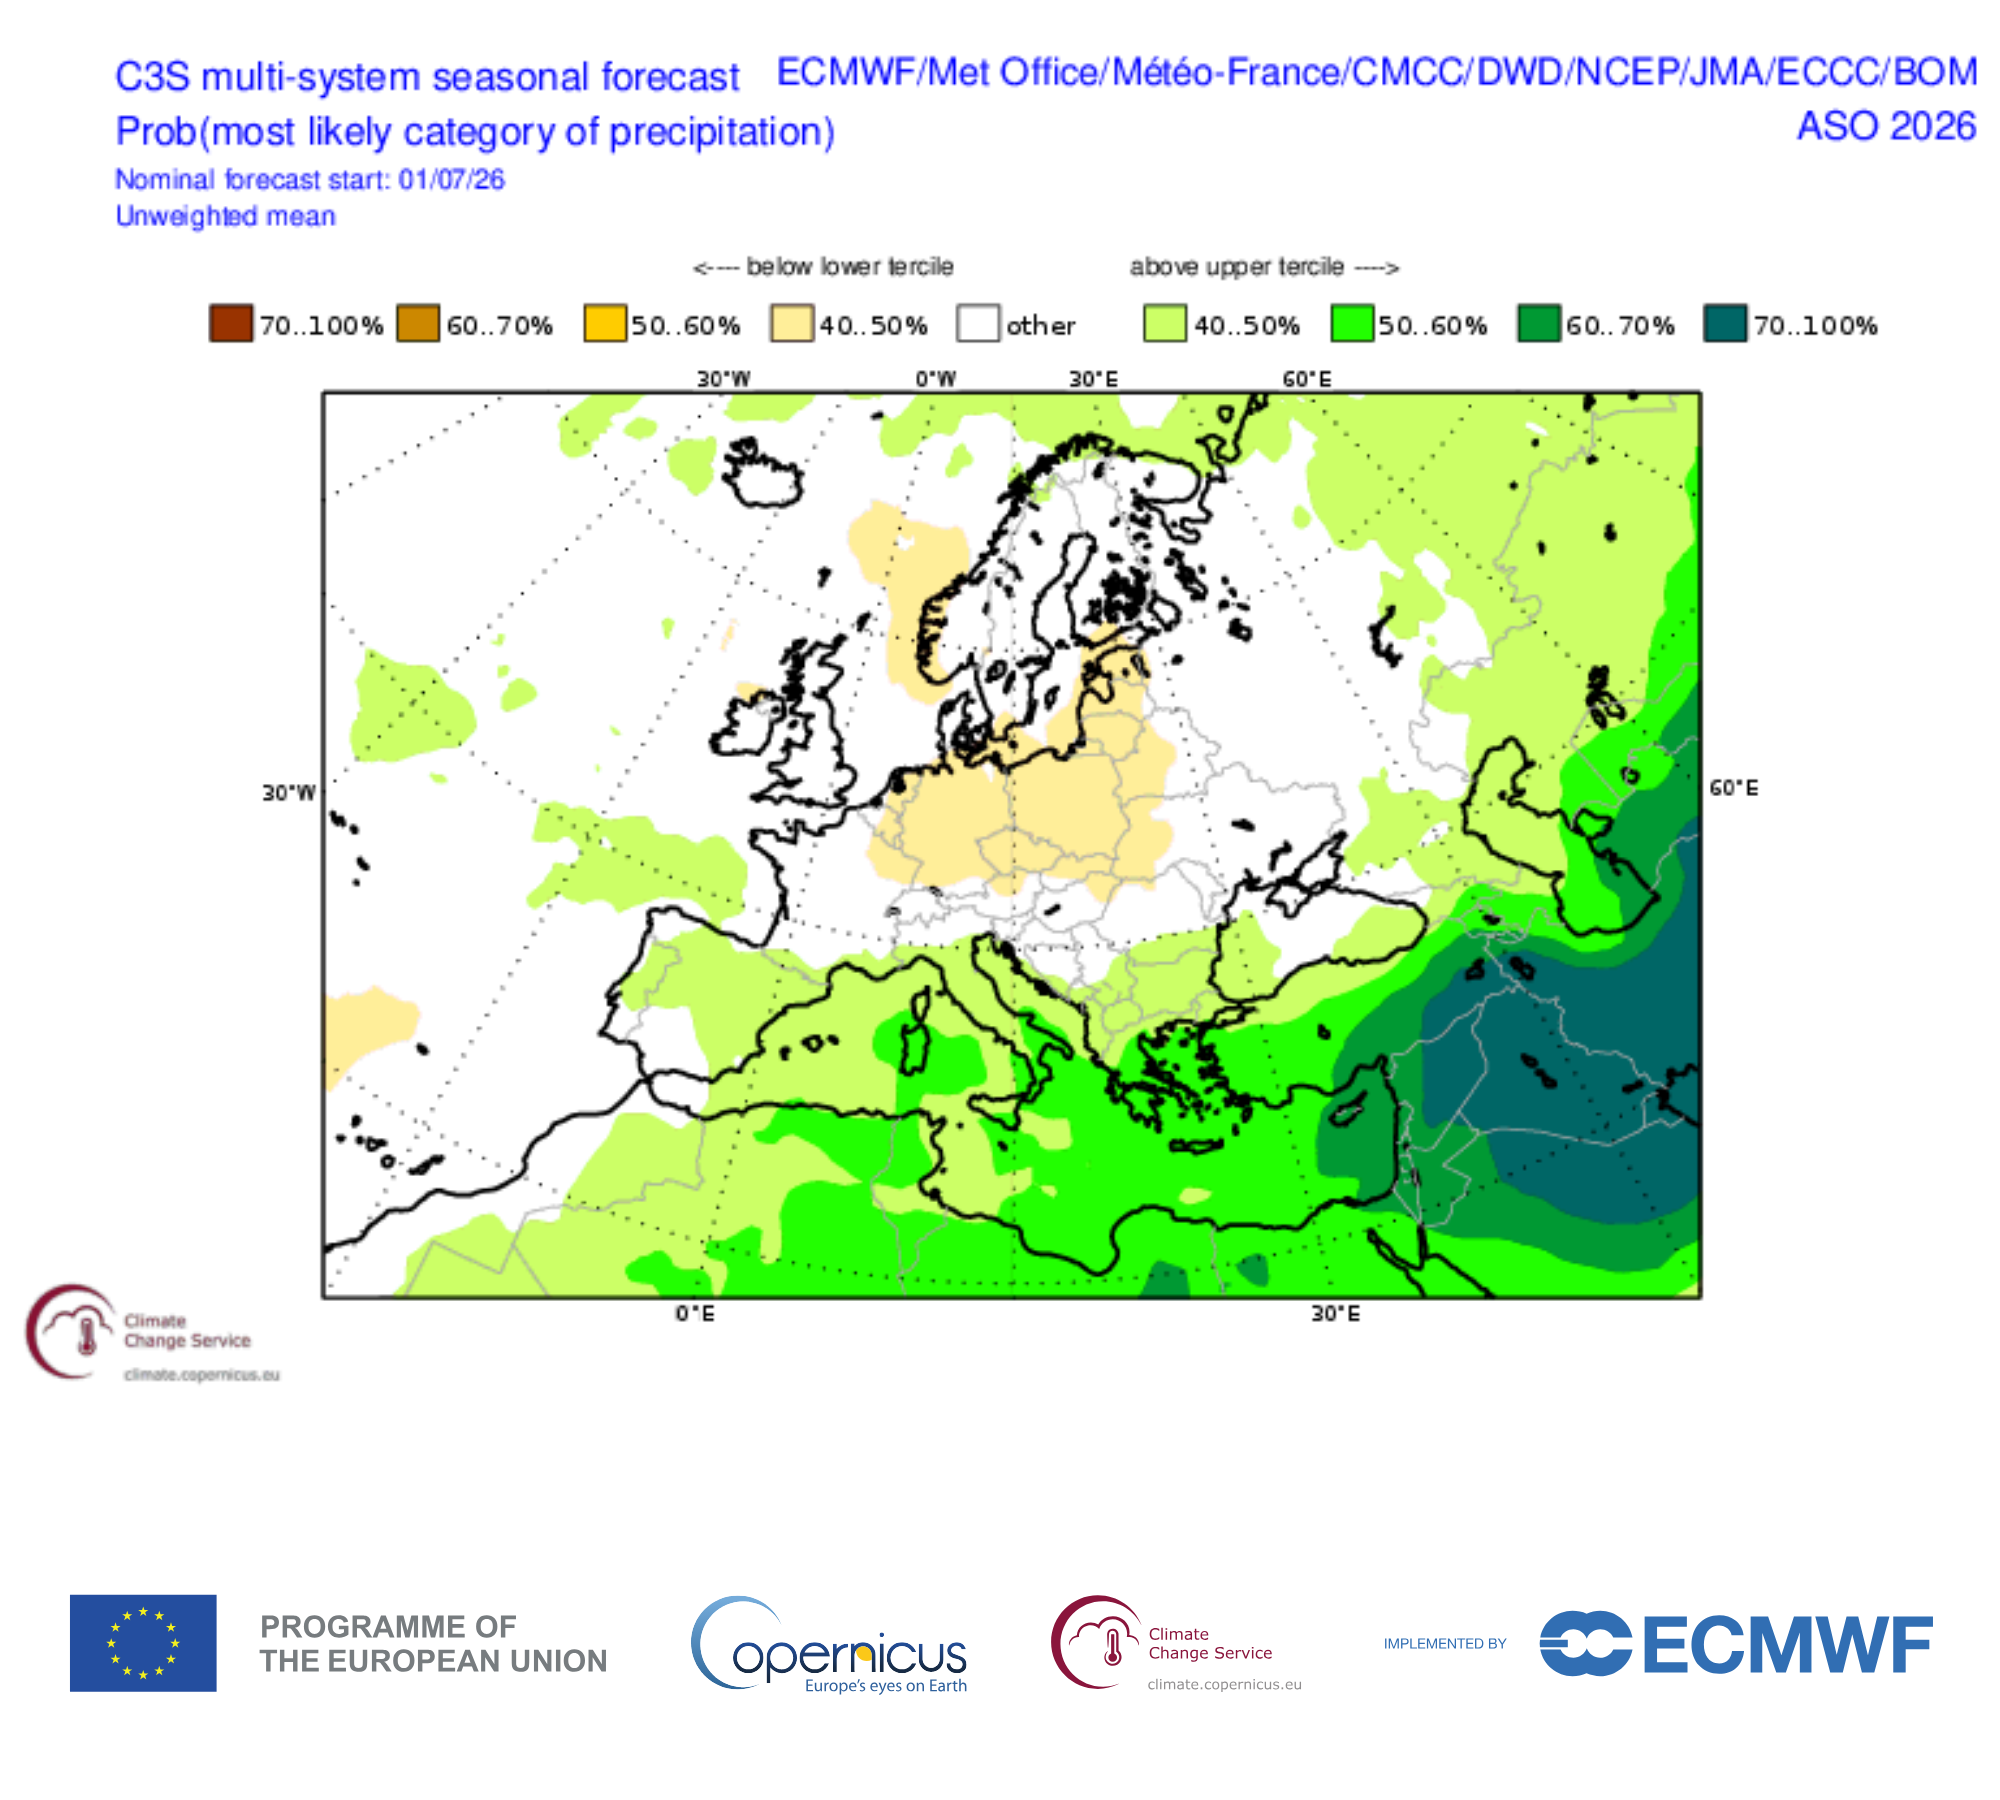
However, the map below shows no clear wet signal in the seasonal forecast models. Let’s hope the history trumps the models this year.

Copernicus C3S multi-model tercile probability forecast for August–October 2026, based on July simulations with 8 models. Colours indicate regions where the probability of below-normal (shades of red) or above-normal (shades of green) precipitation exceeds 40% relative to the model climatology.

Updated maps of El Niño/La Niña effects on temperature, rainfall, and pressure

Update on 20 May 2026: Added maps for sea level pressure, thanks to a suggestion by Scott Osprey

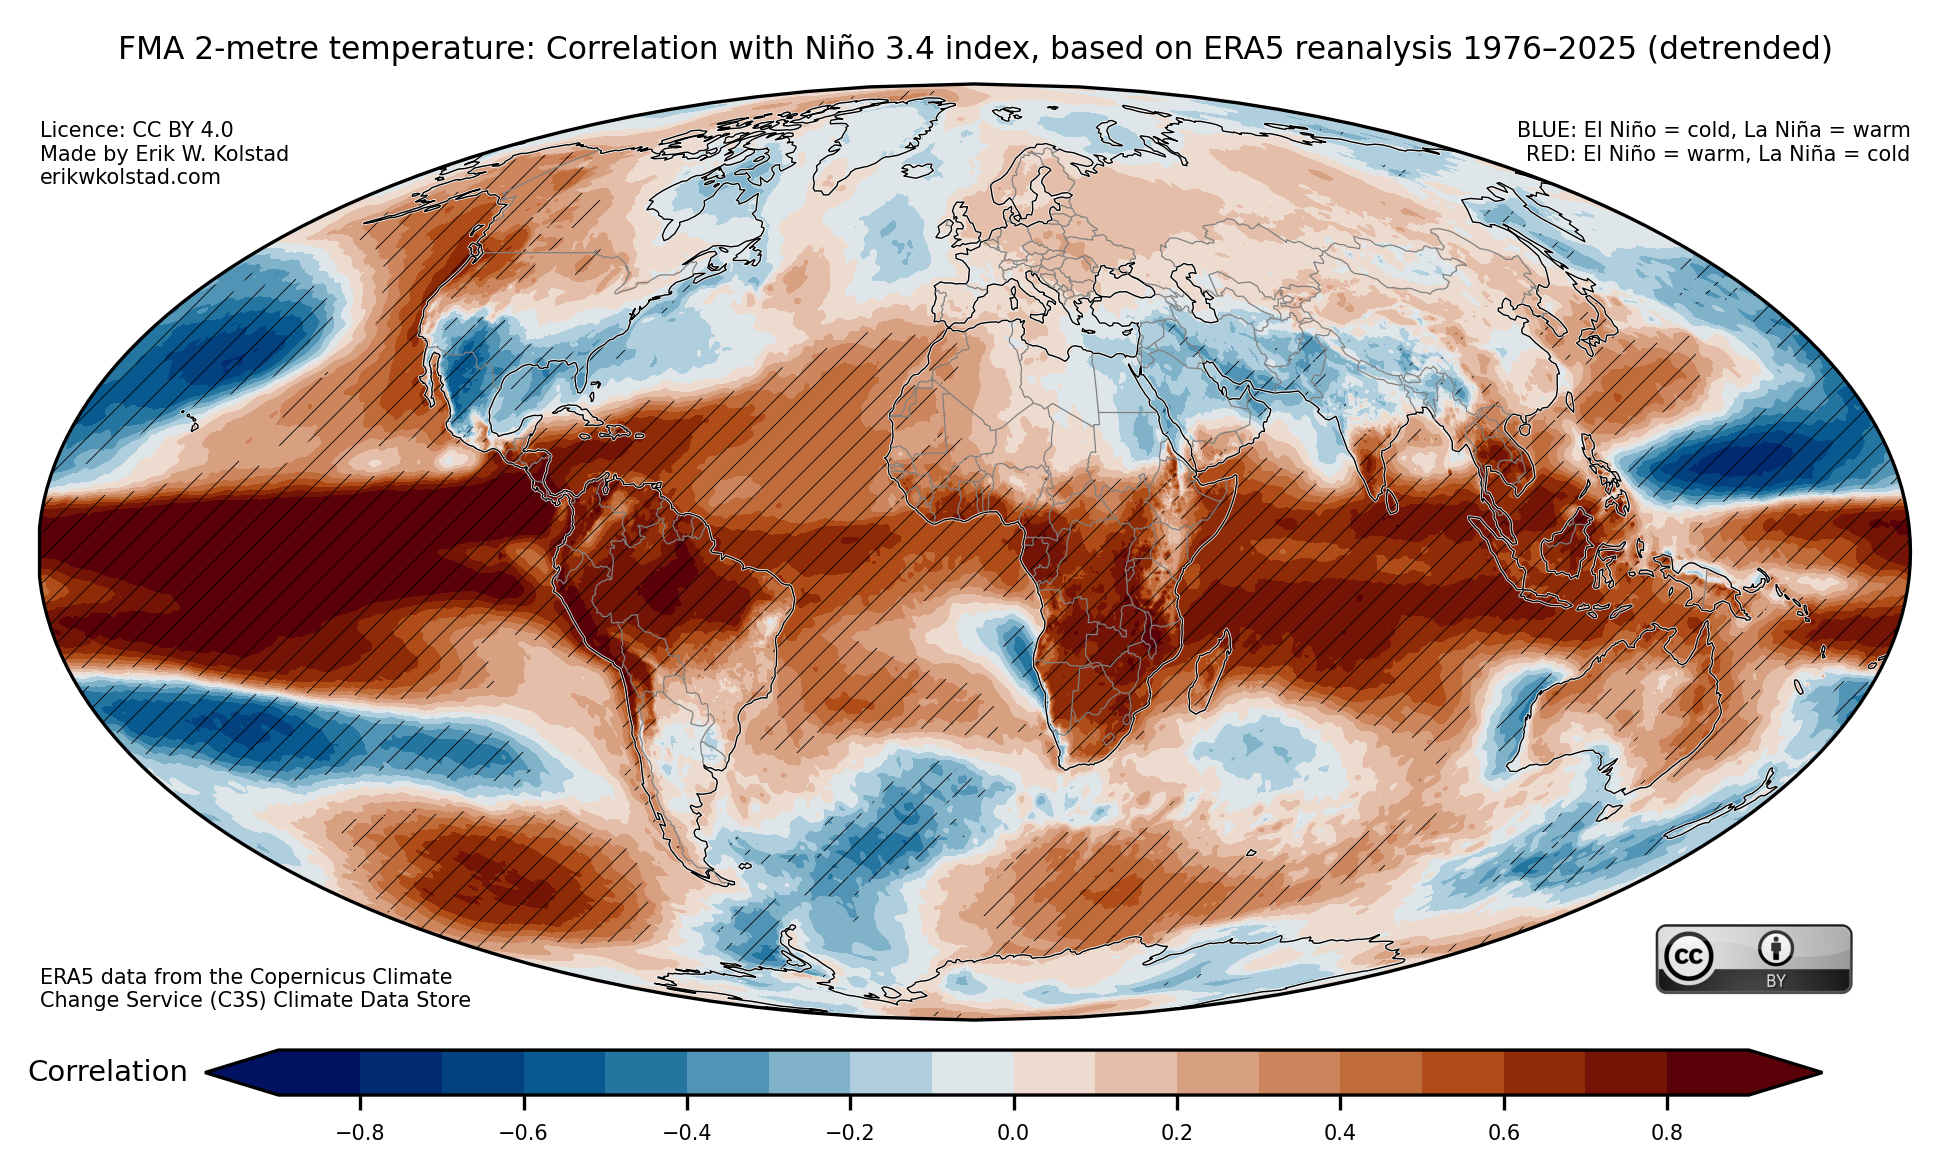
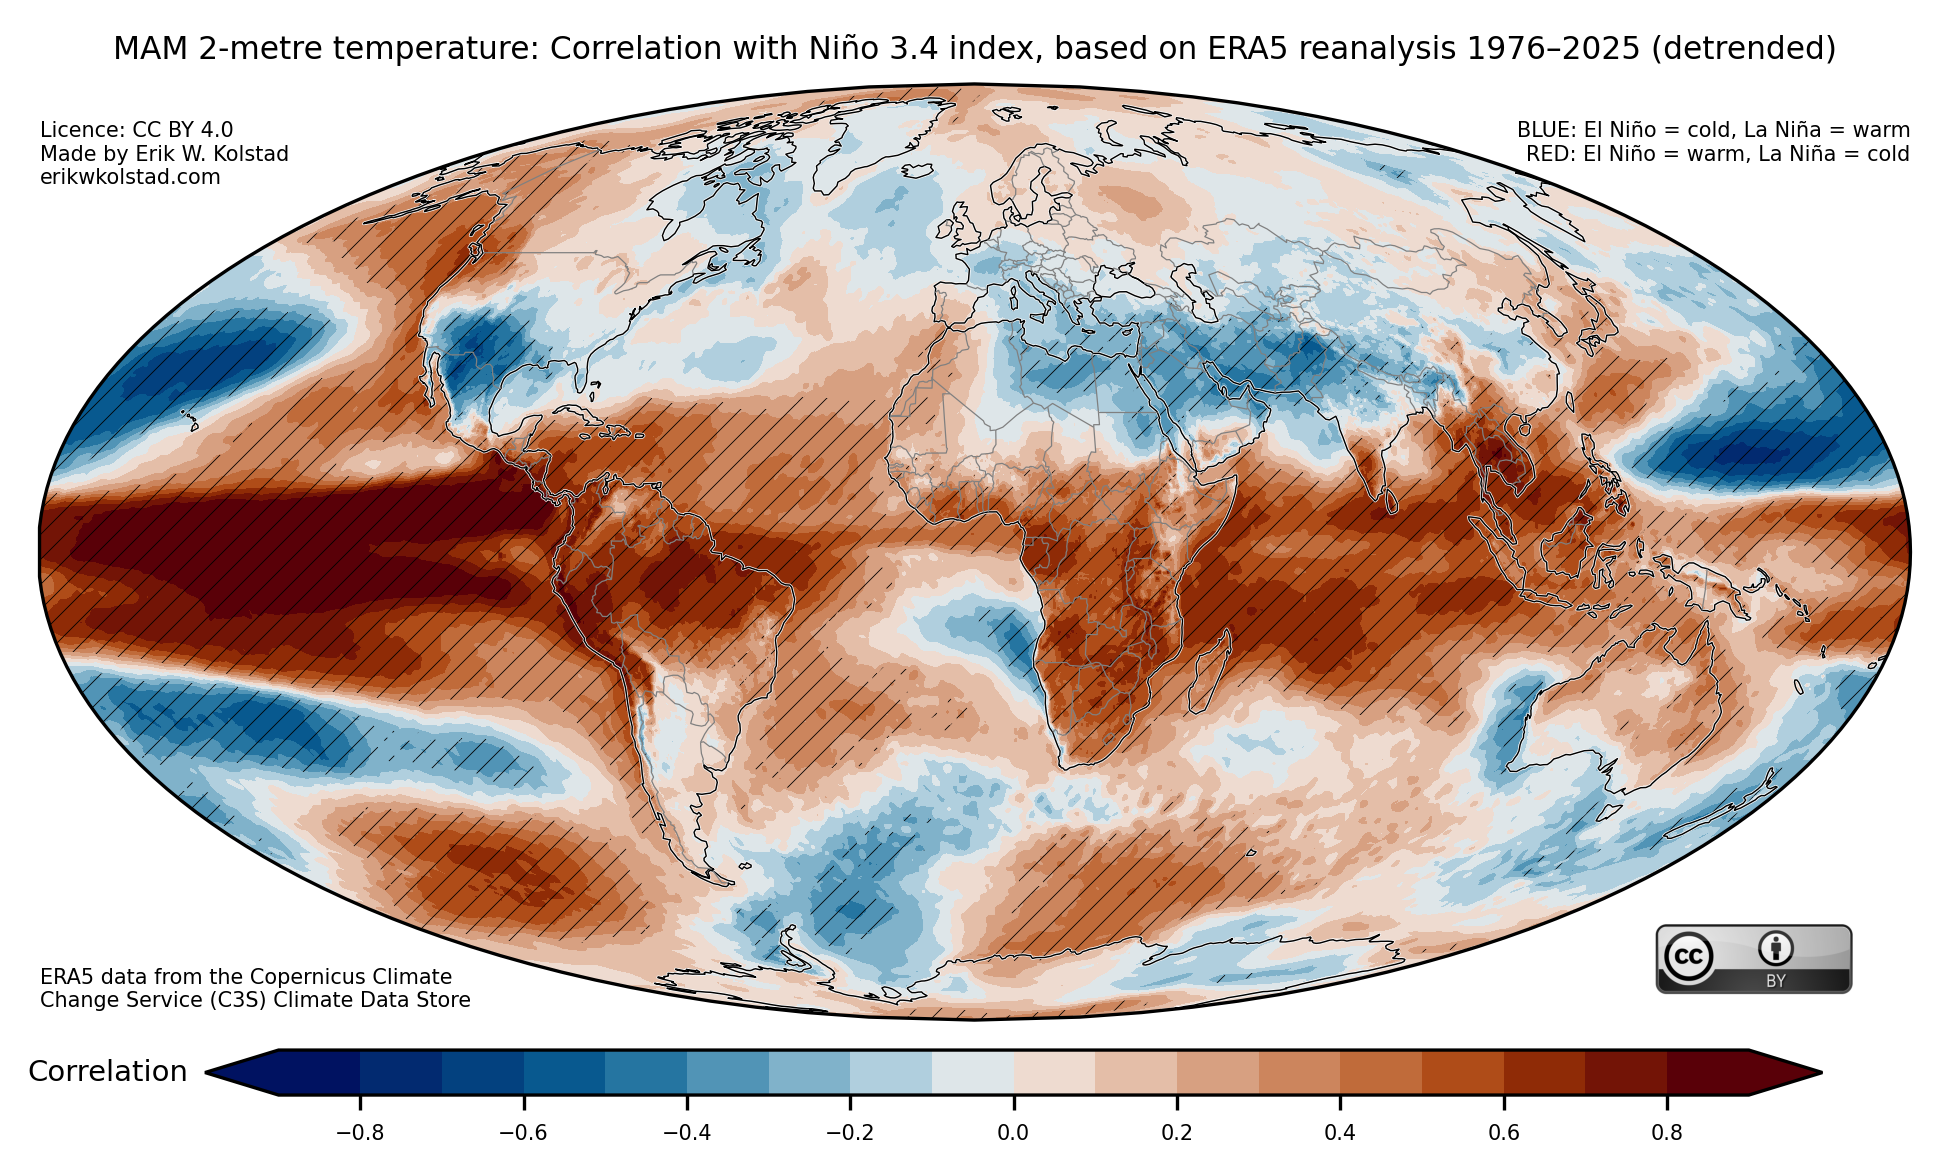
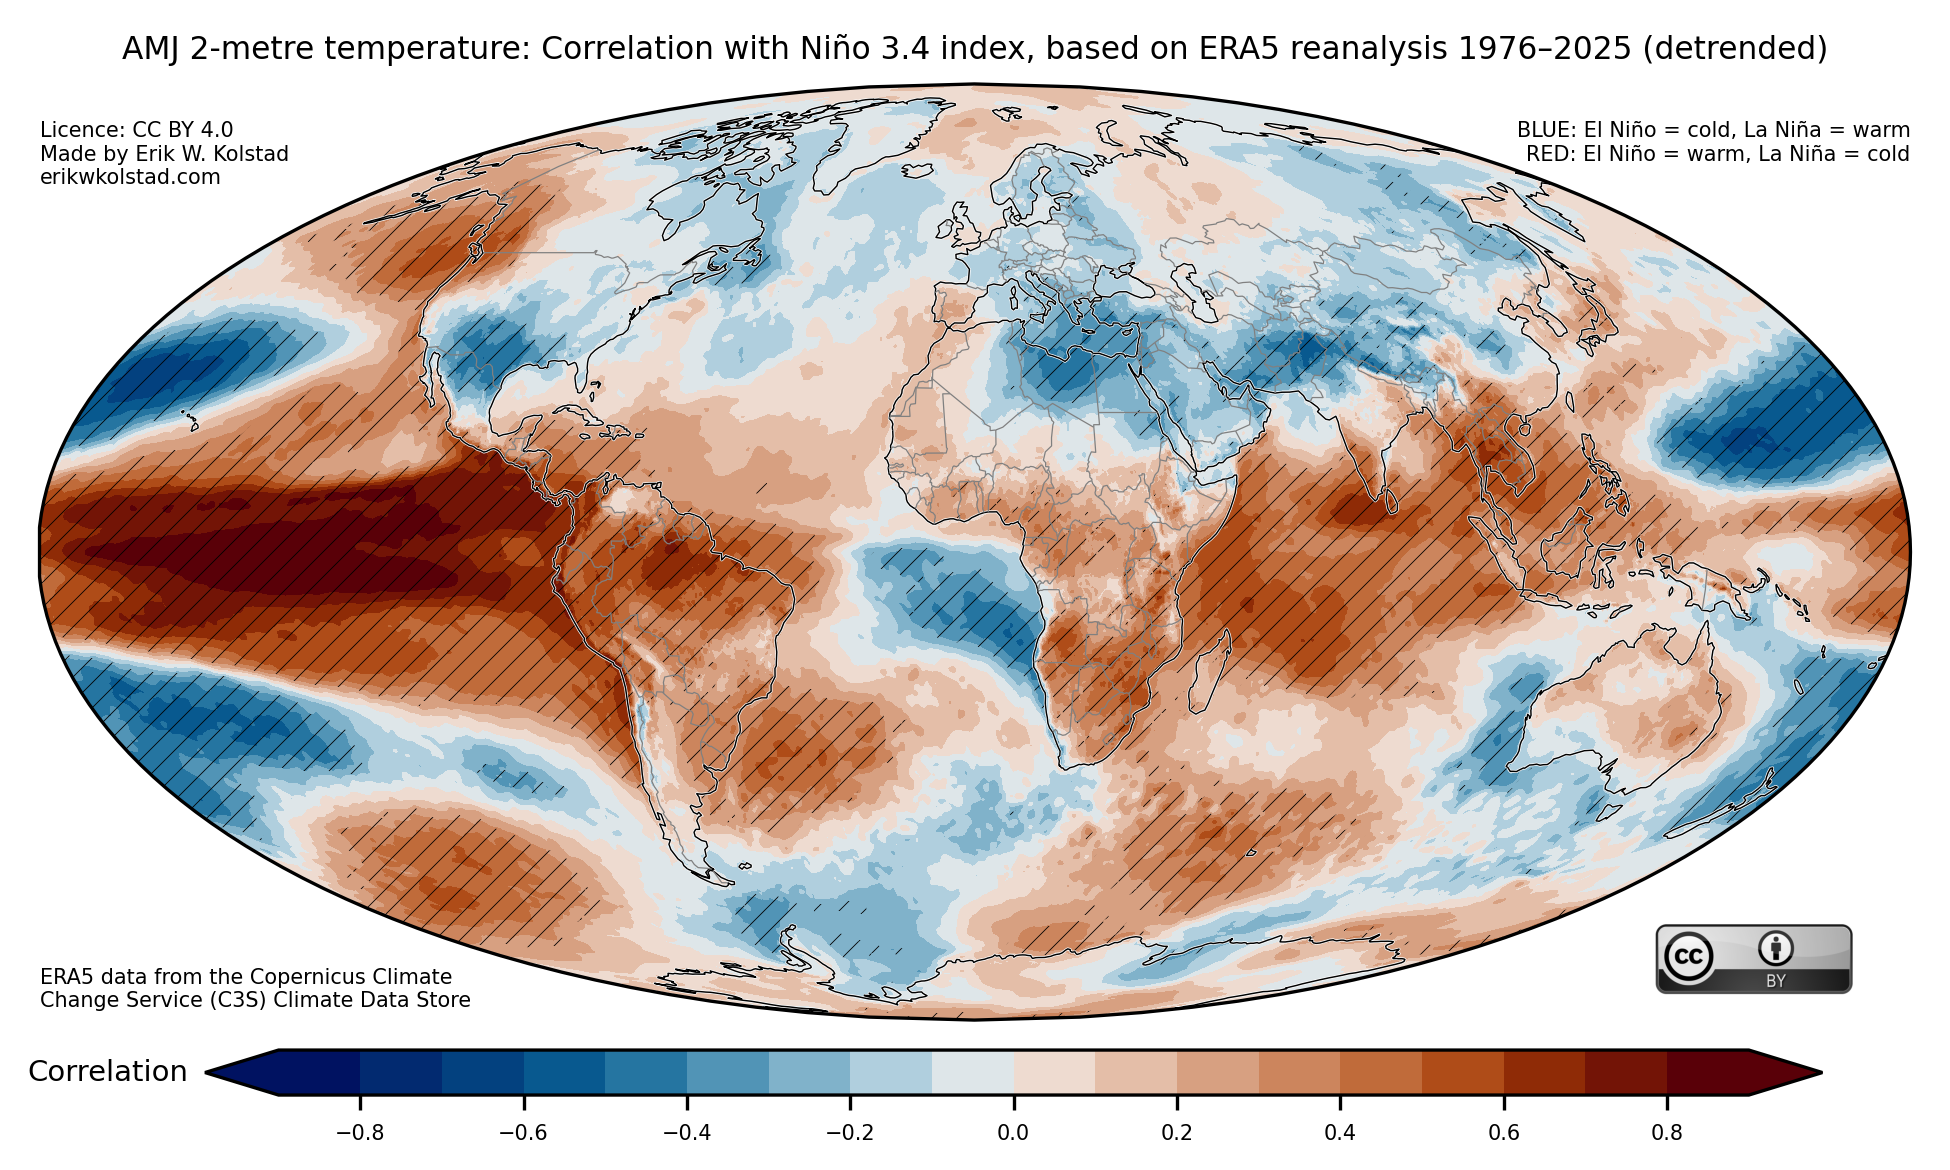
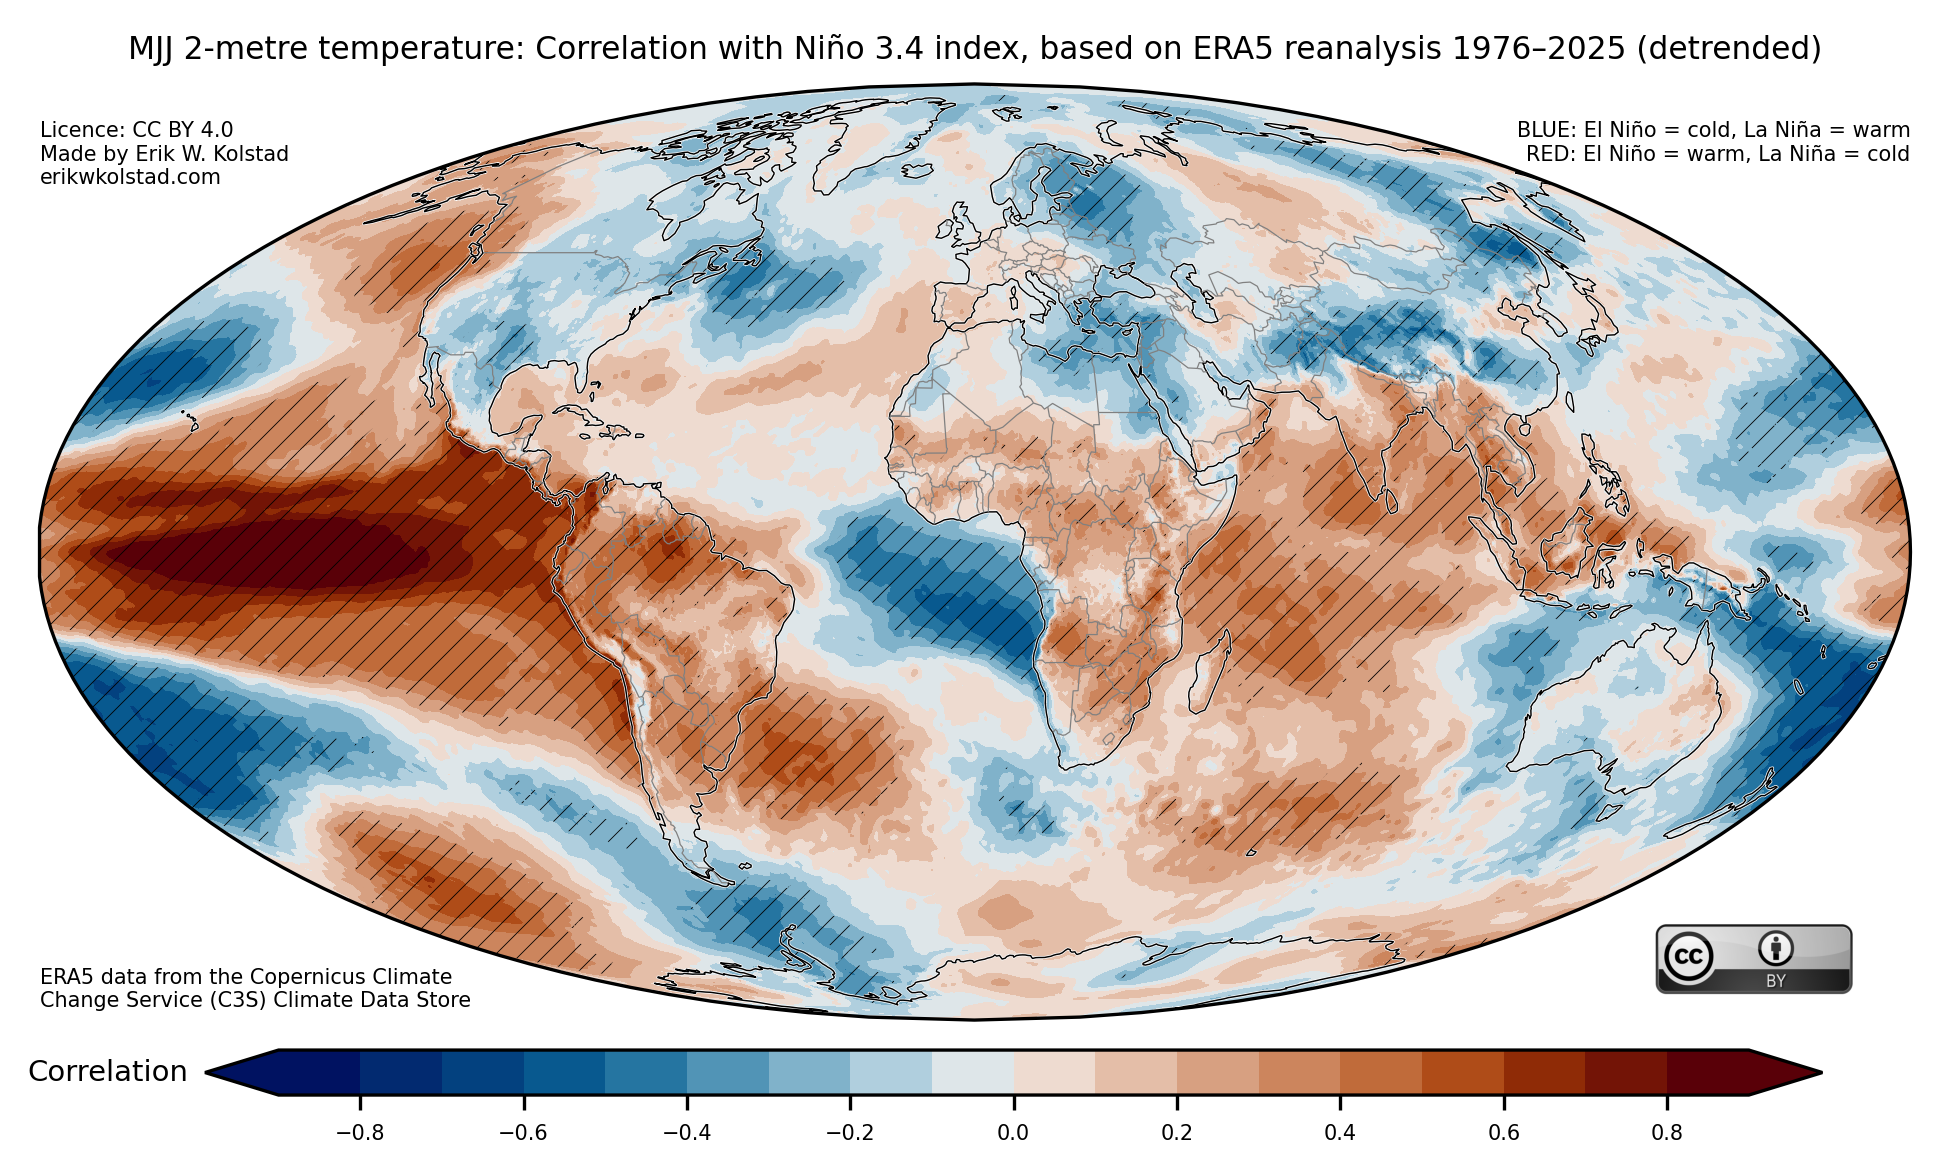
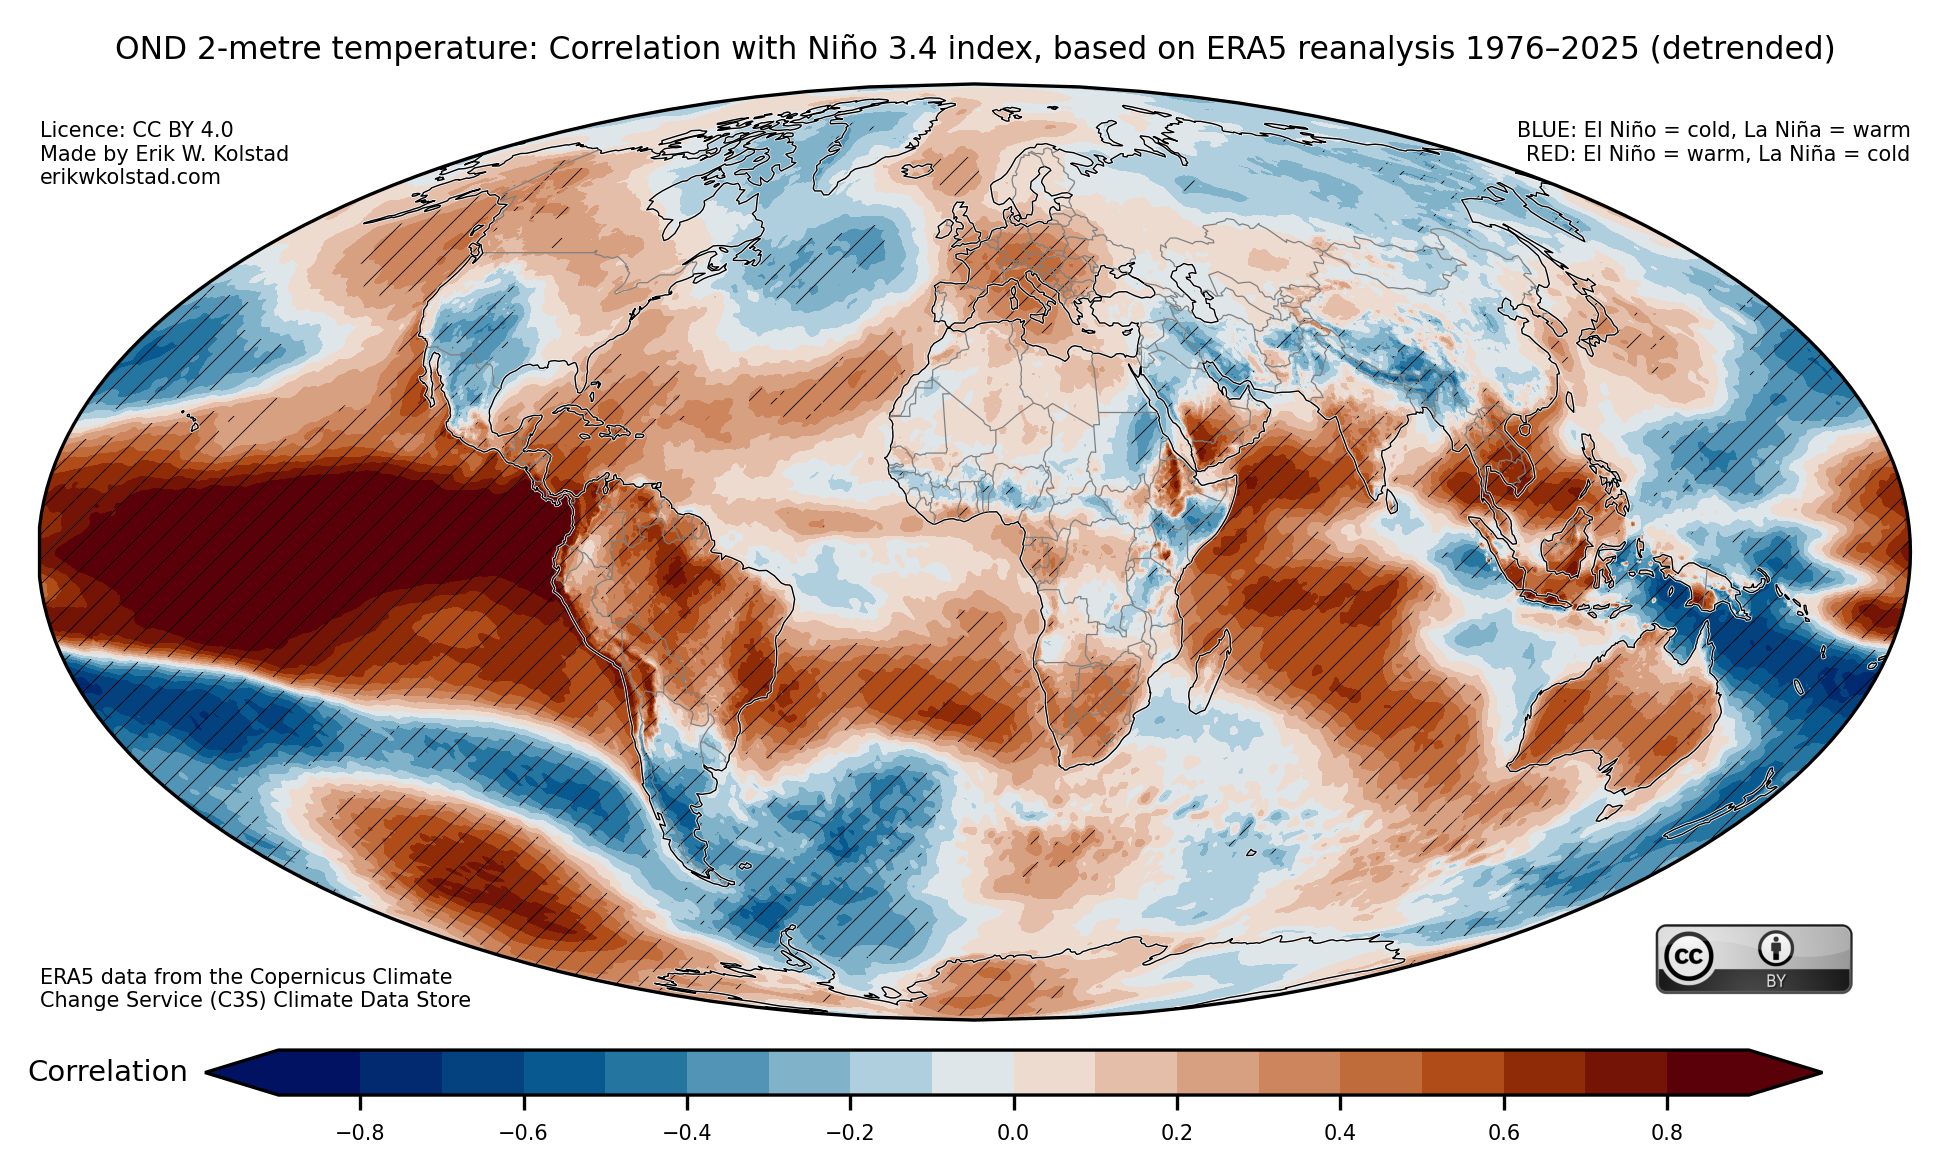
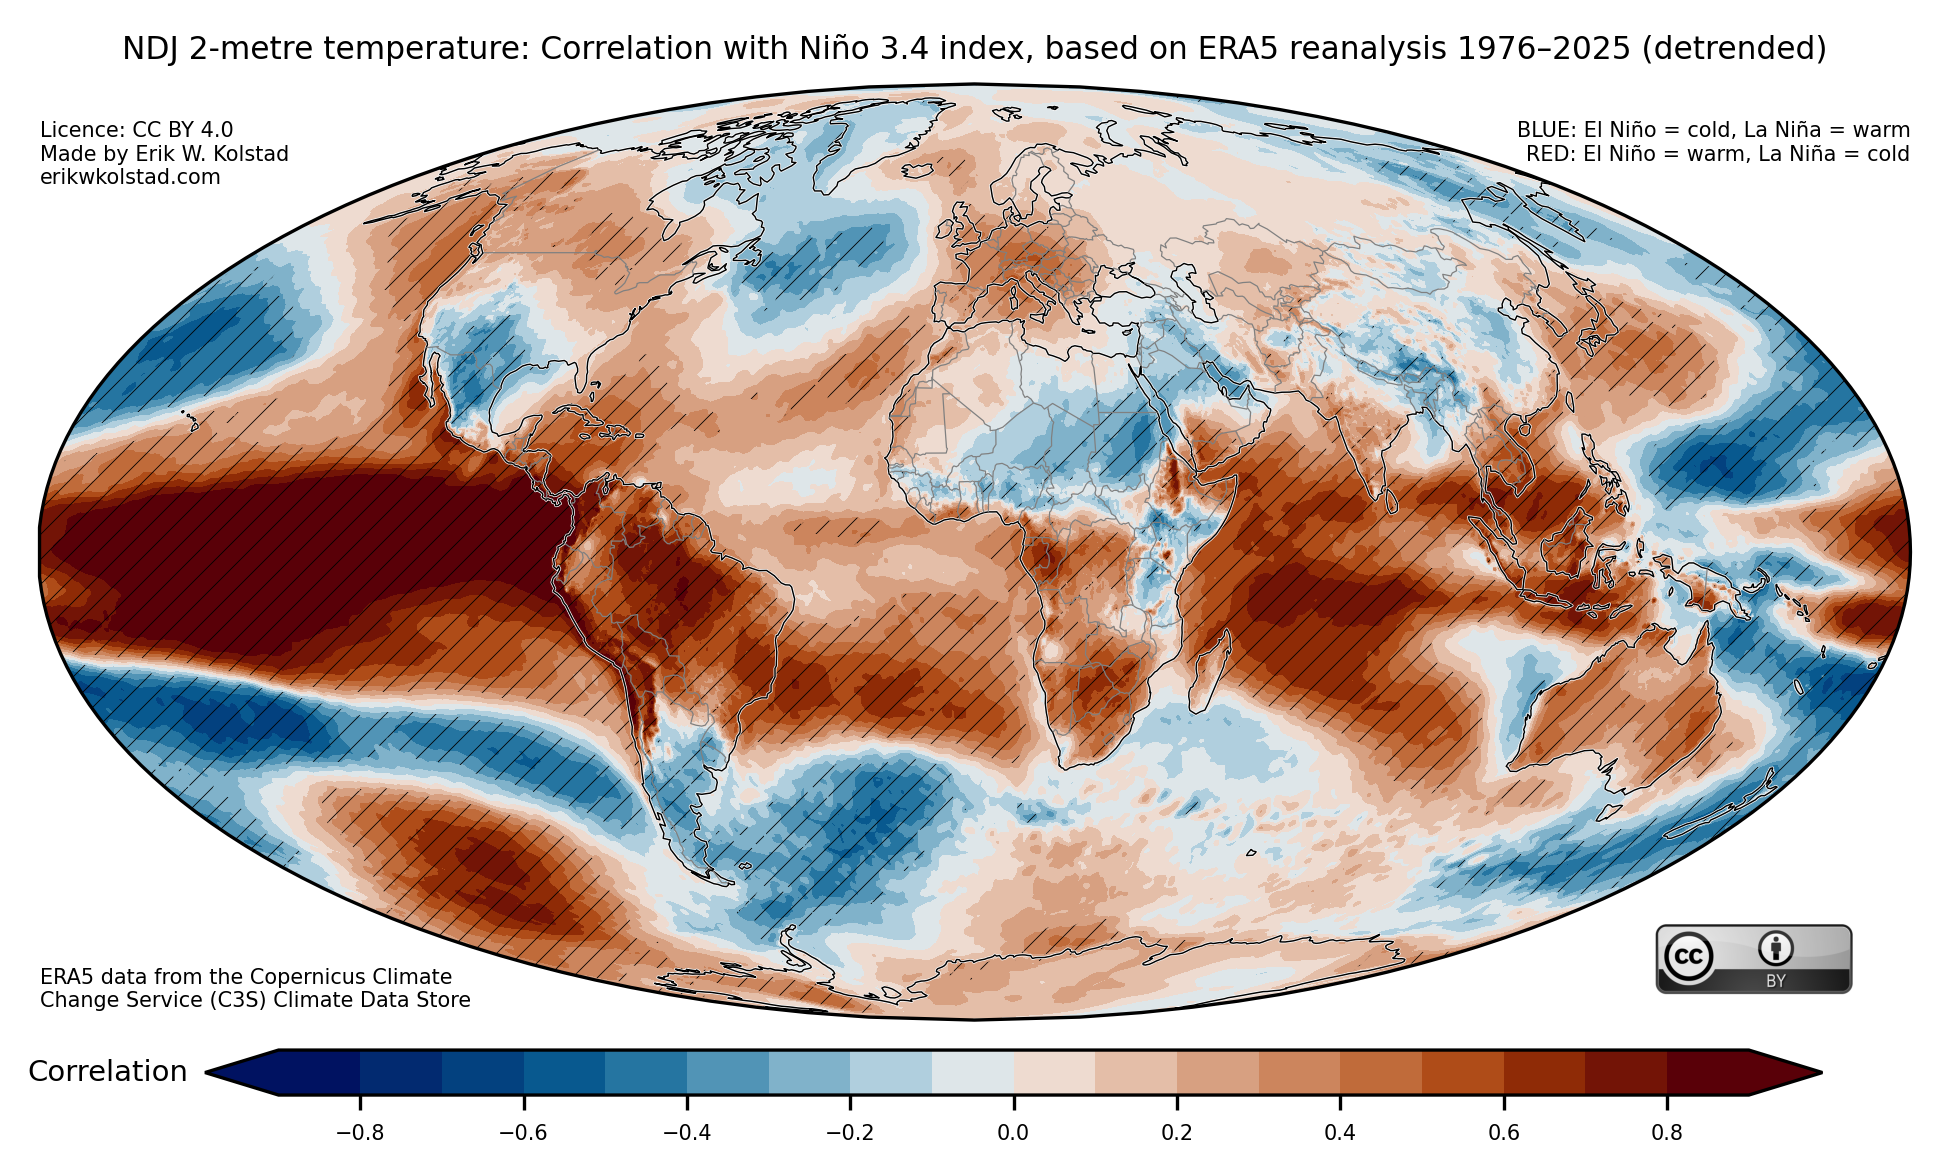
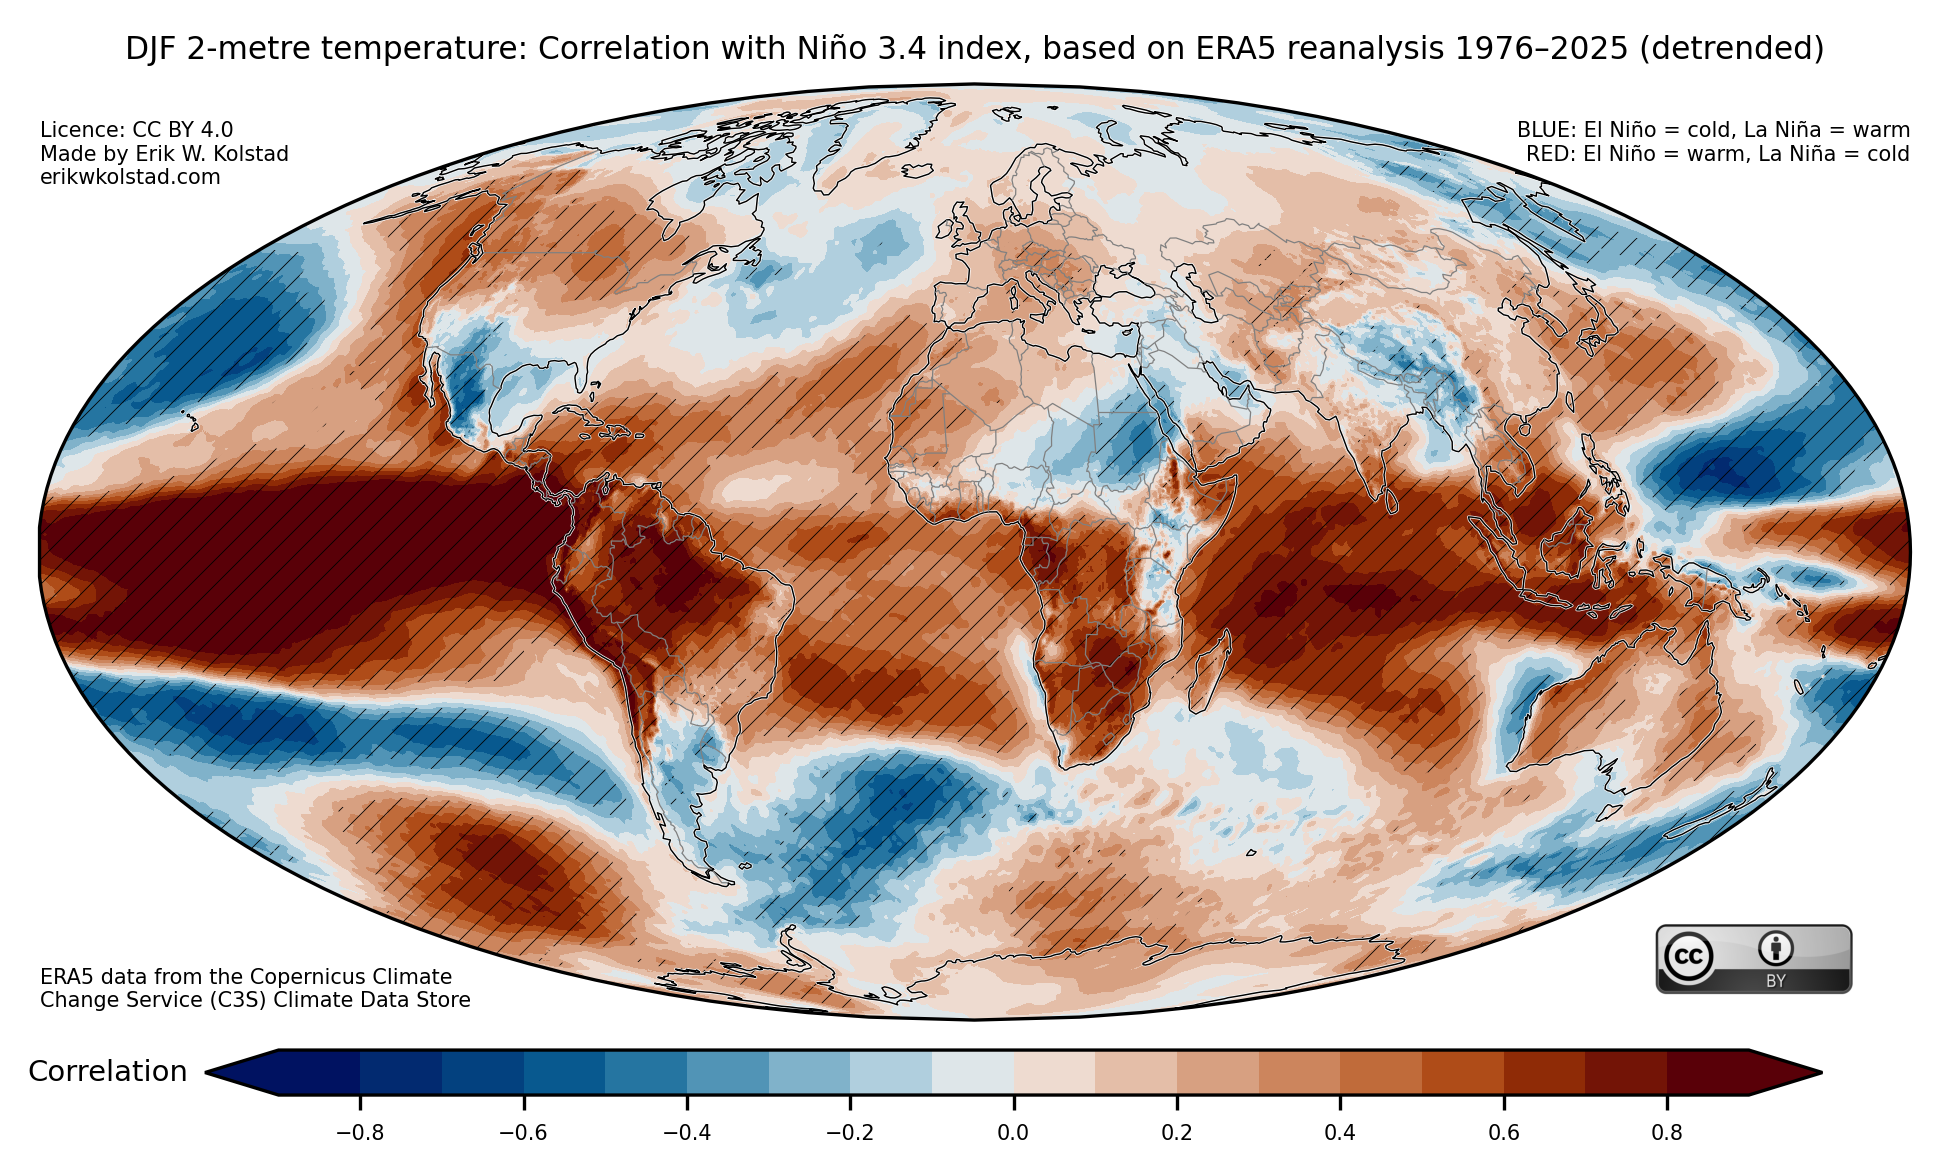
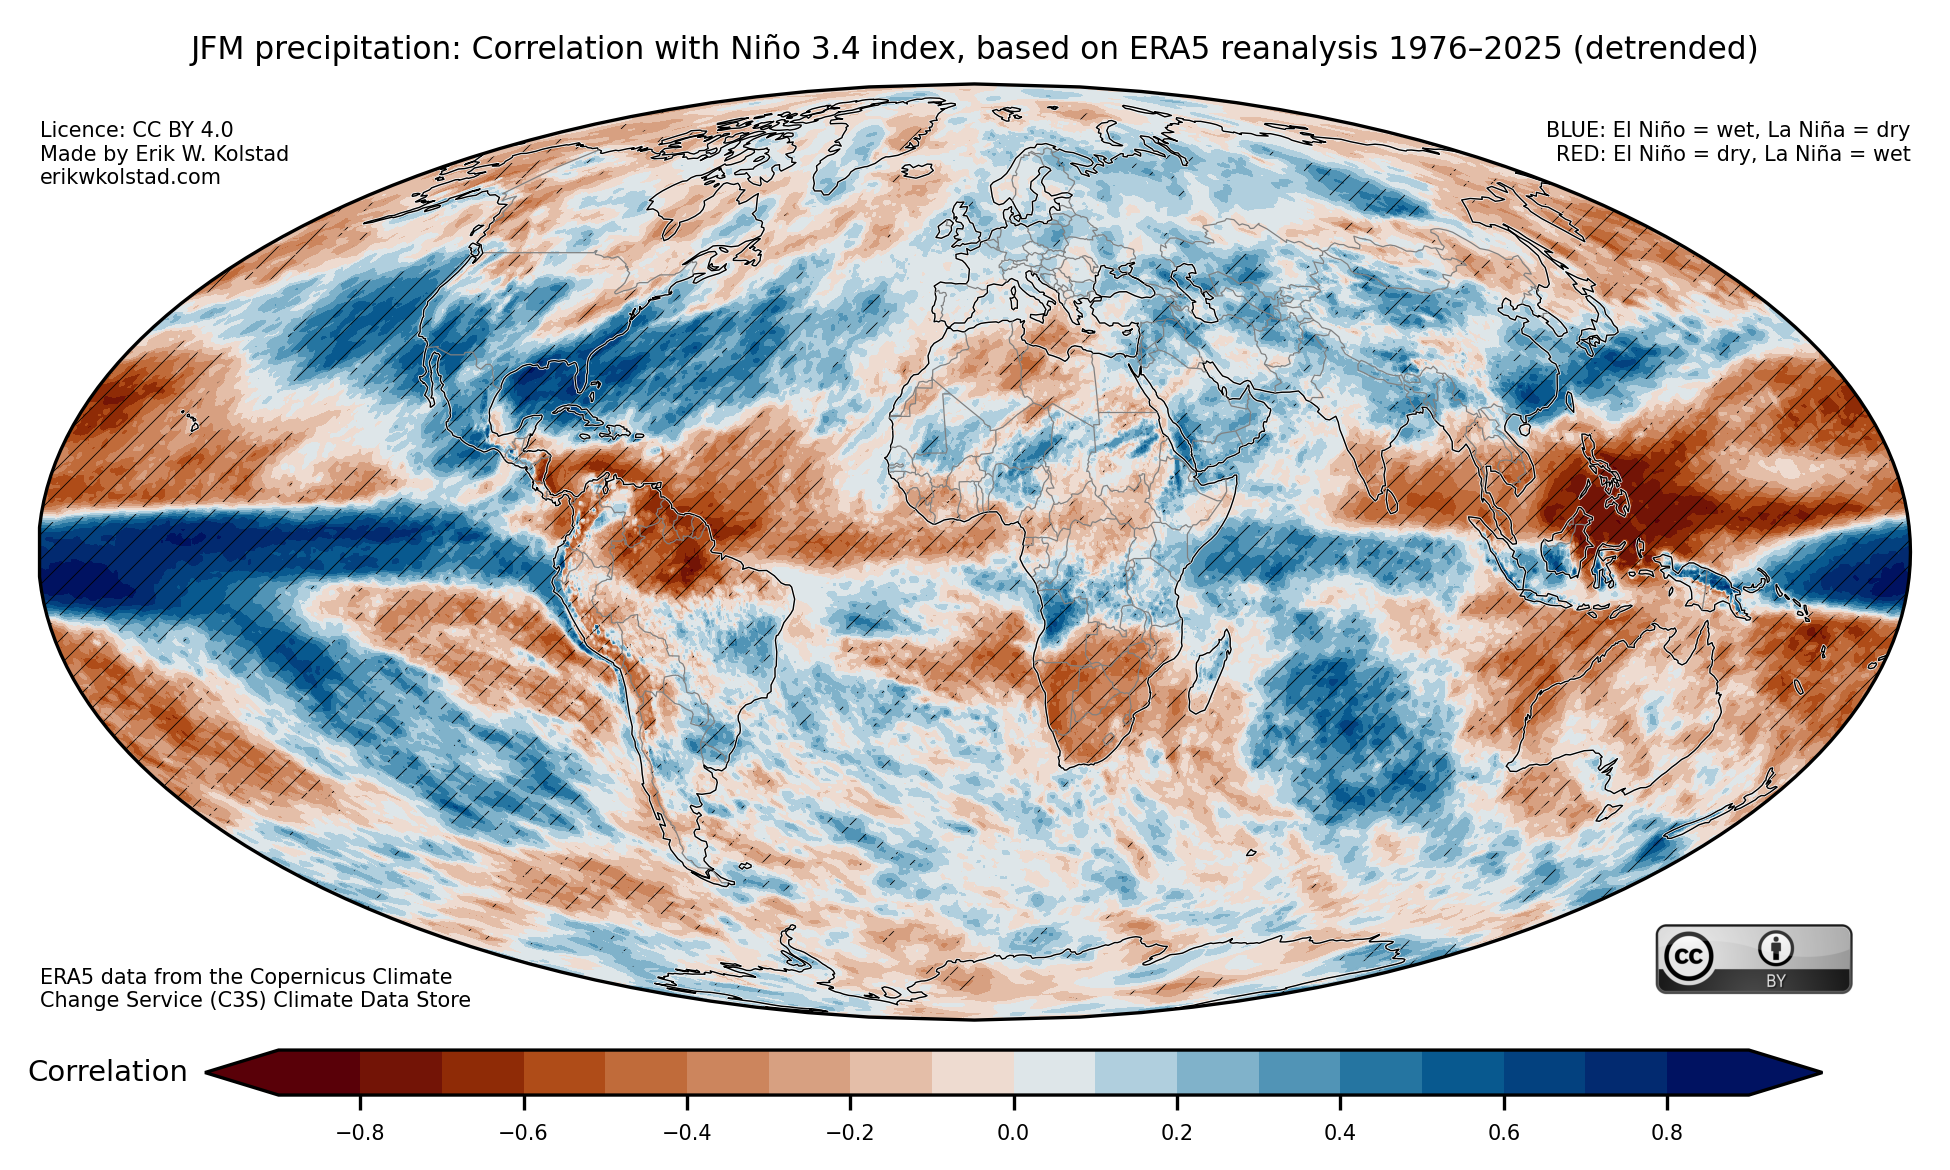
About three years ago, I made some maps illustrating the global relationships between El Niño/La Niña and temperature and precipitation. These have turned out to be quite popular, so I updated them (and added maps for sea level pressure) using data up to February 2026. I also detrended the data, i.e. removed the linear trend over the period (see the brief methodology section at the bottom of this post for more details).

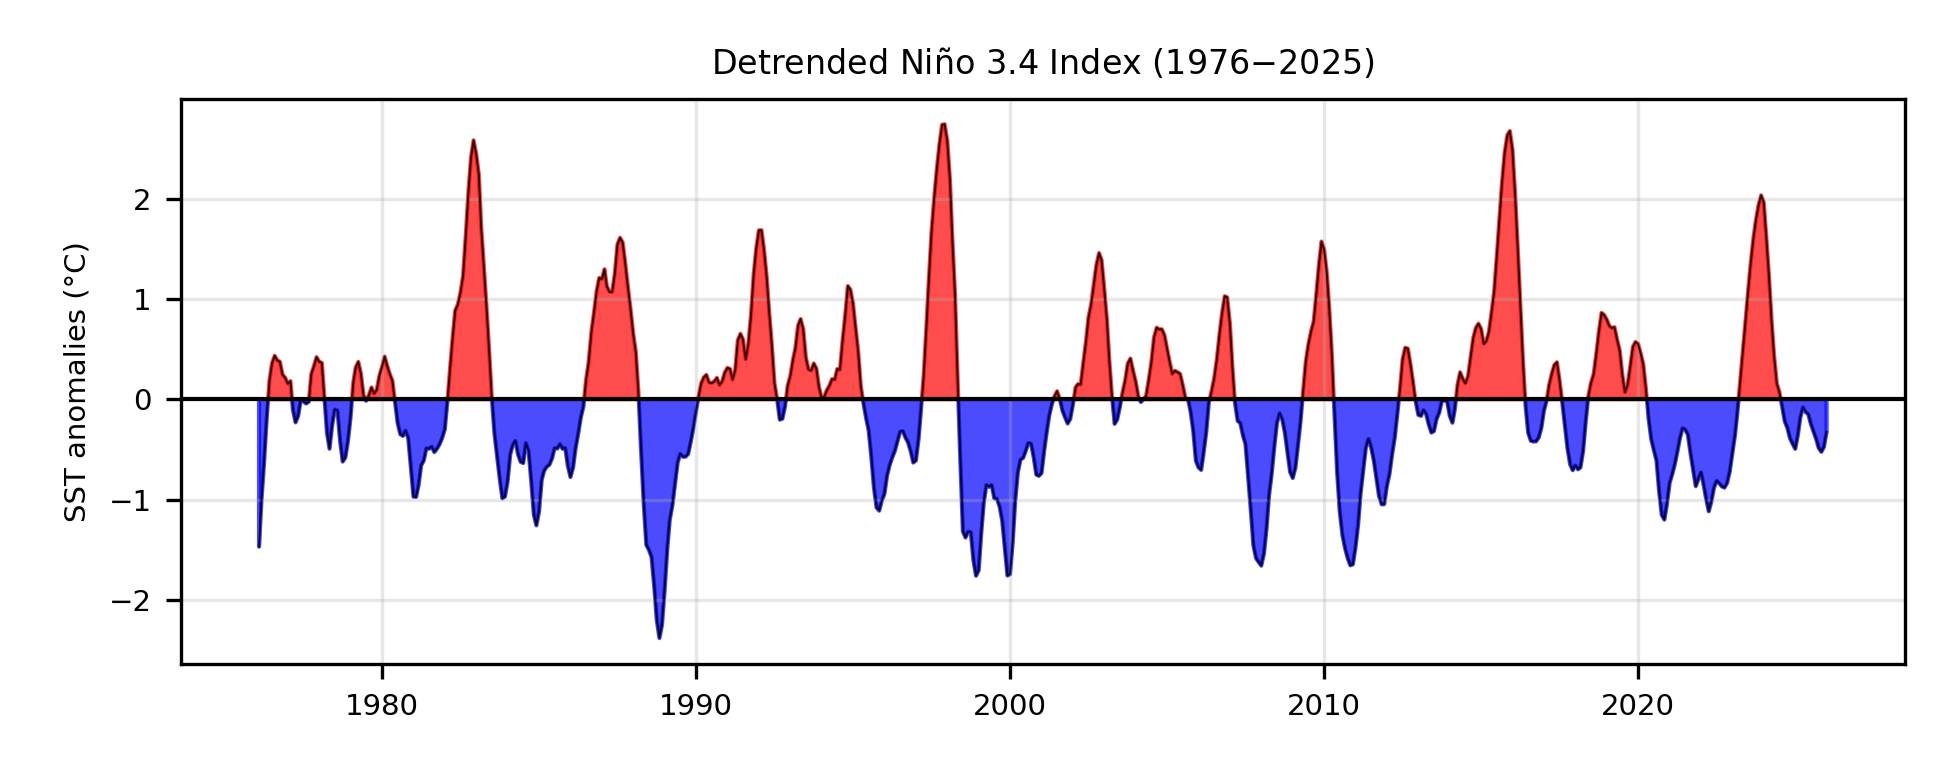
First, here’s the time series of the Niño 3.4 index for each centred three-month window starting in February 1976 up until January 2026:

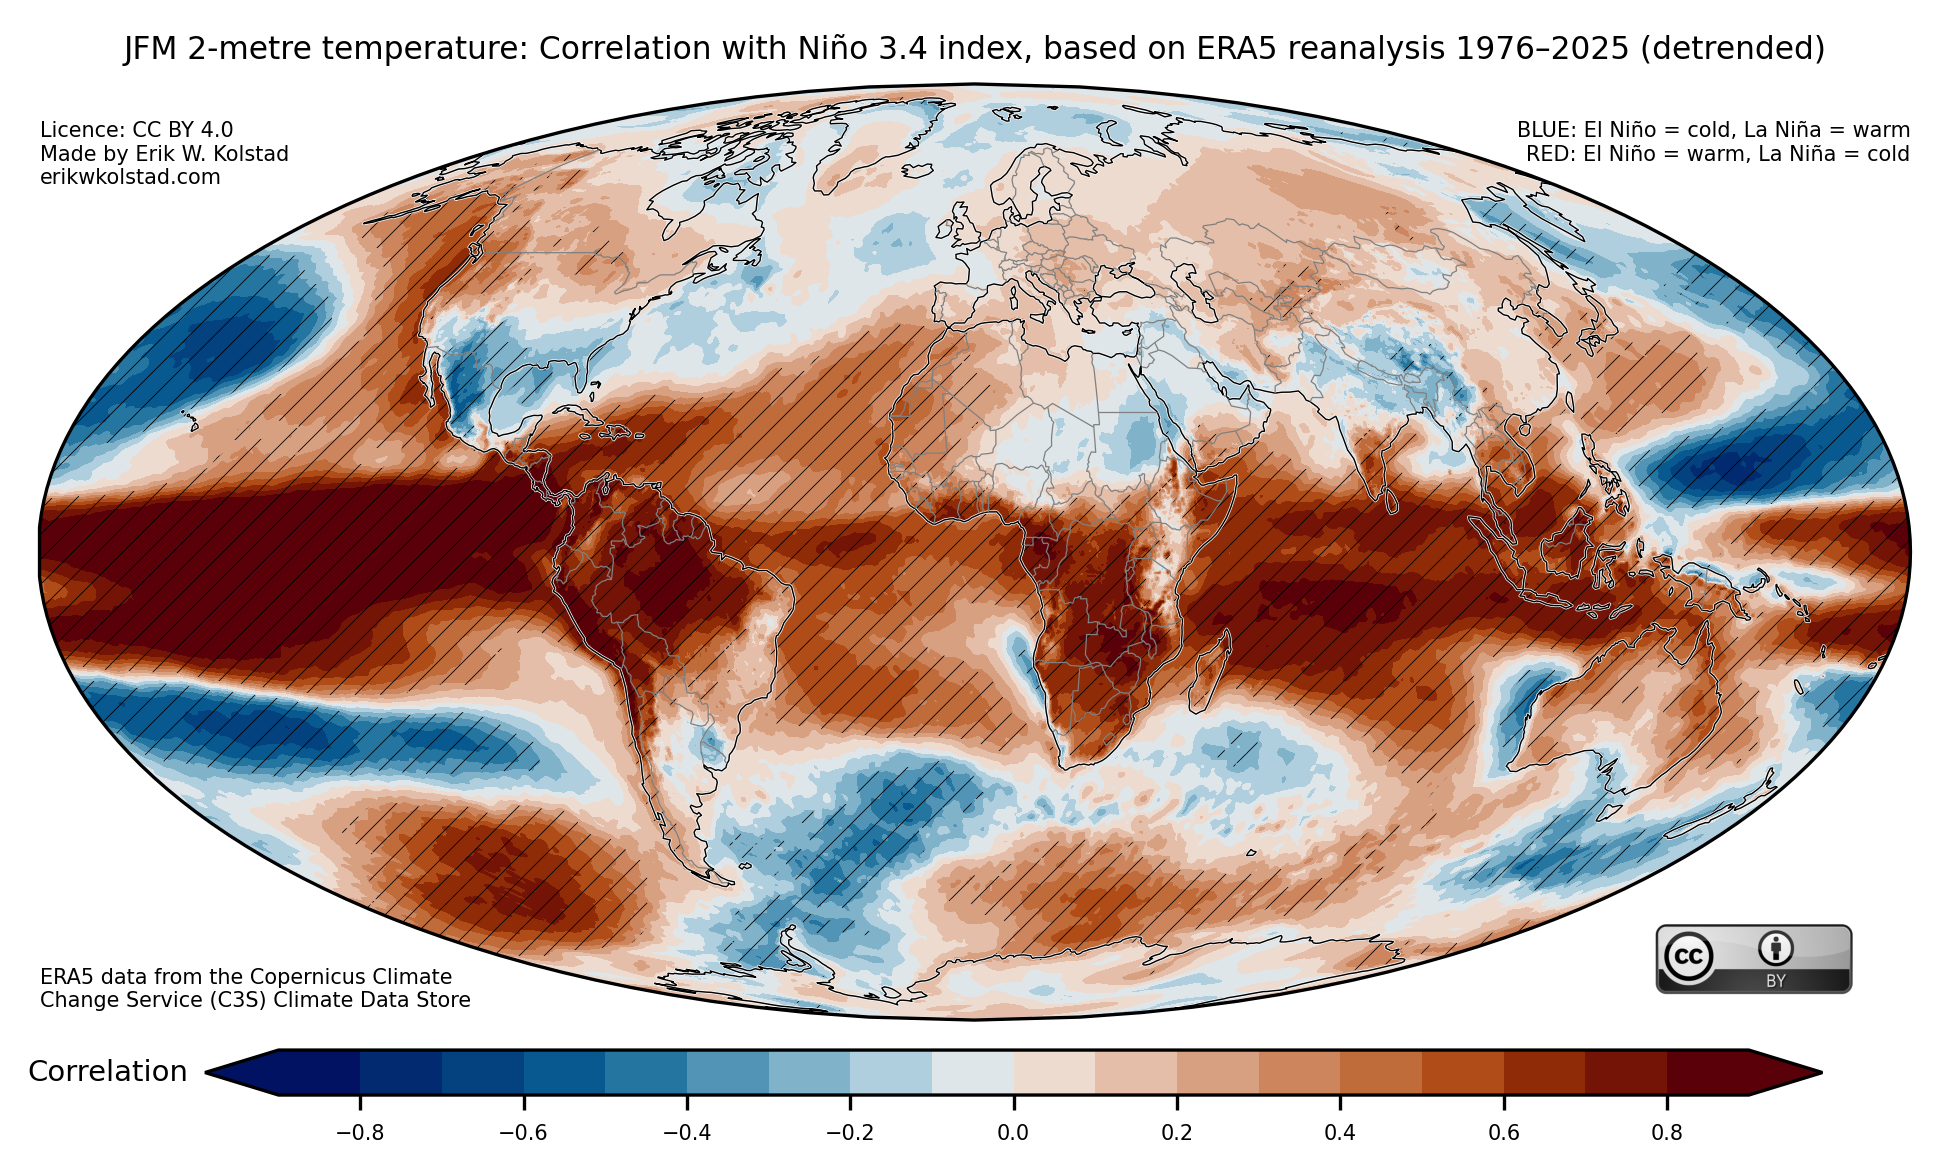
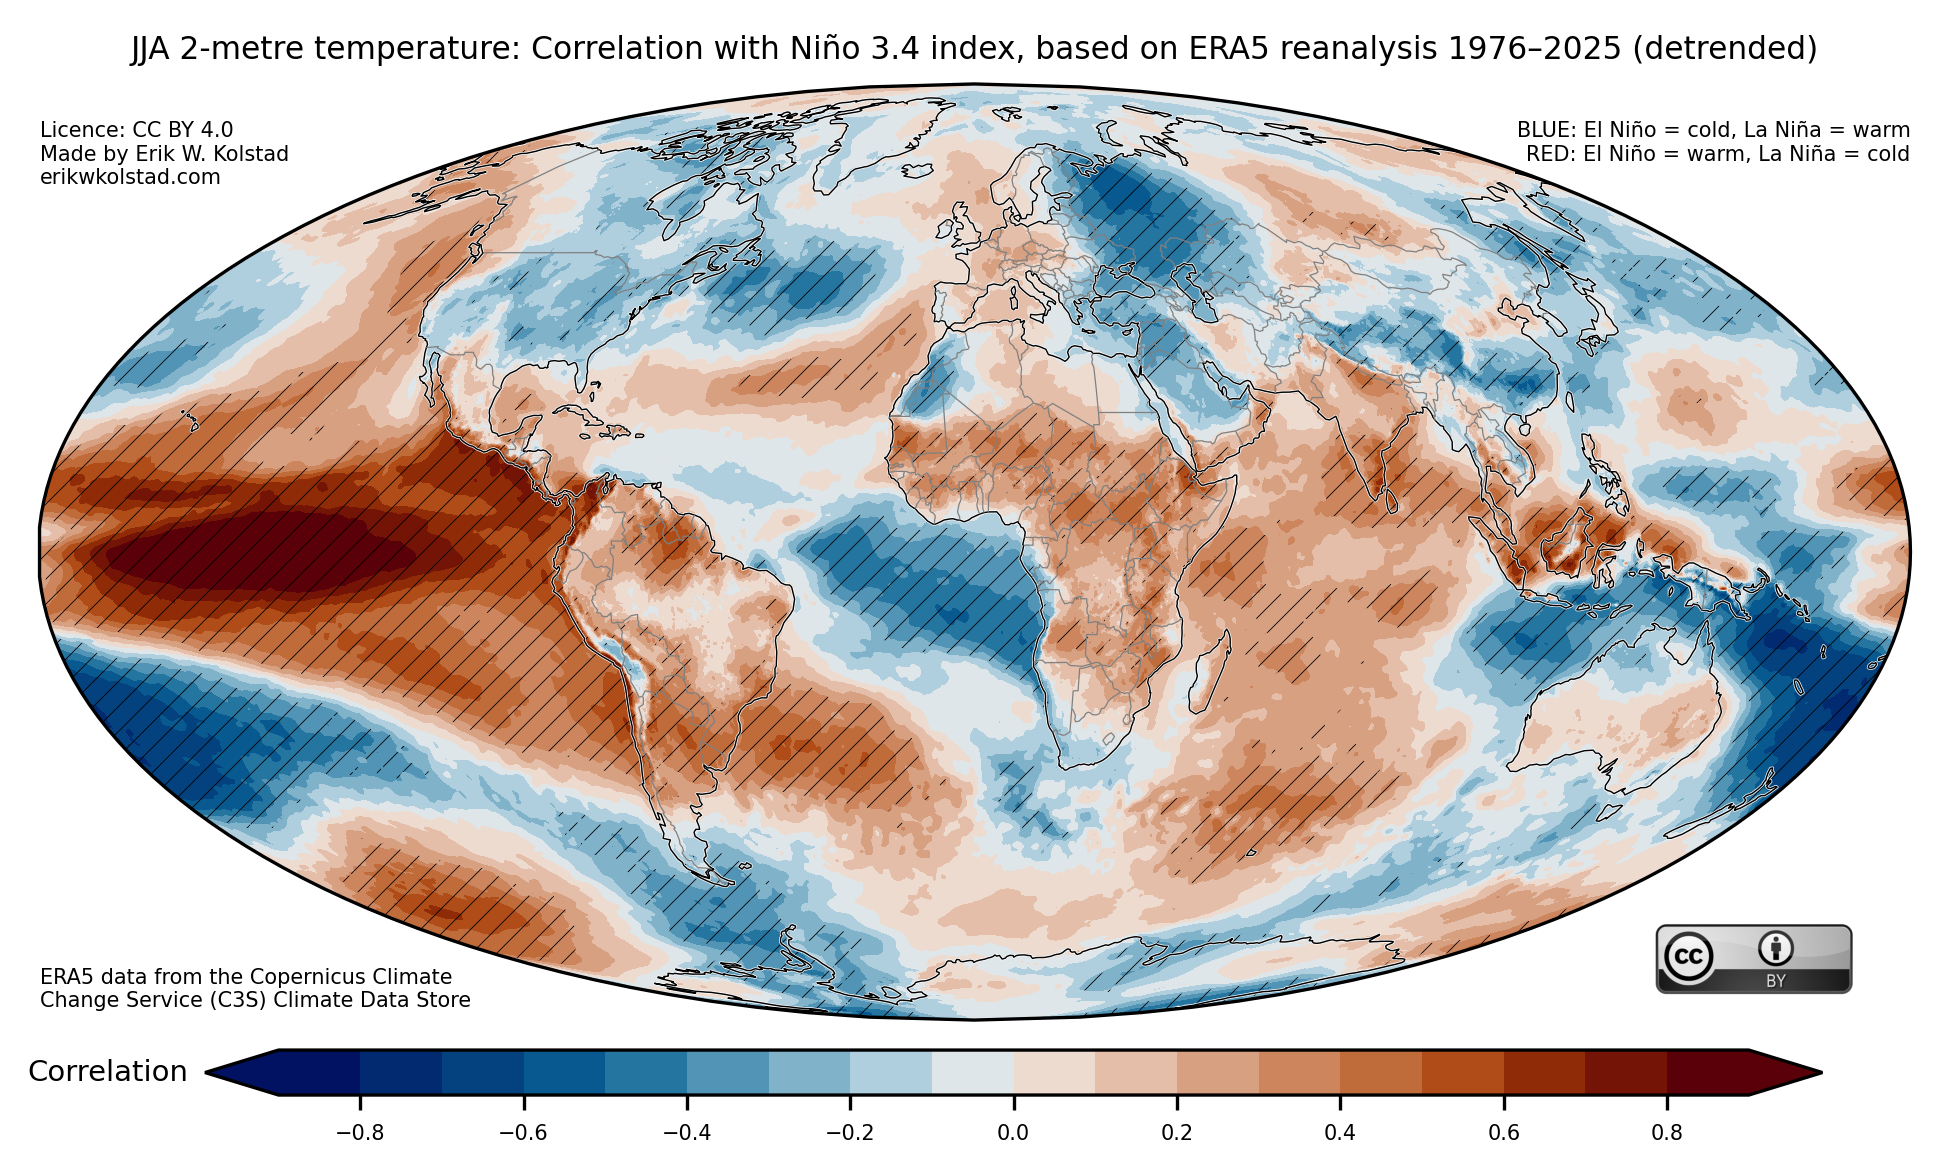
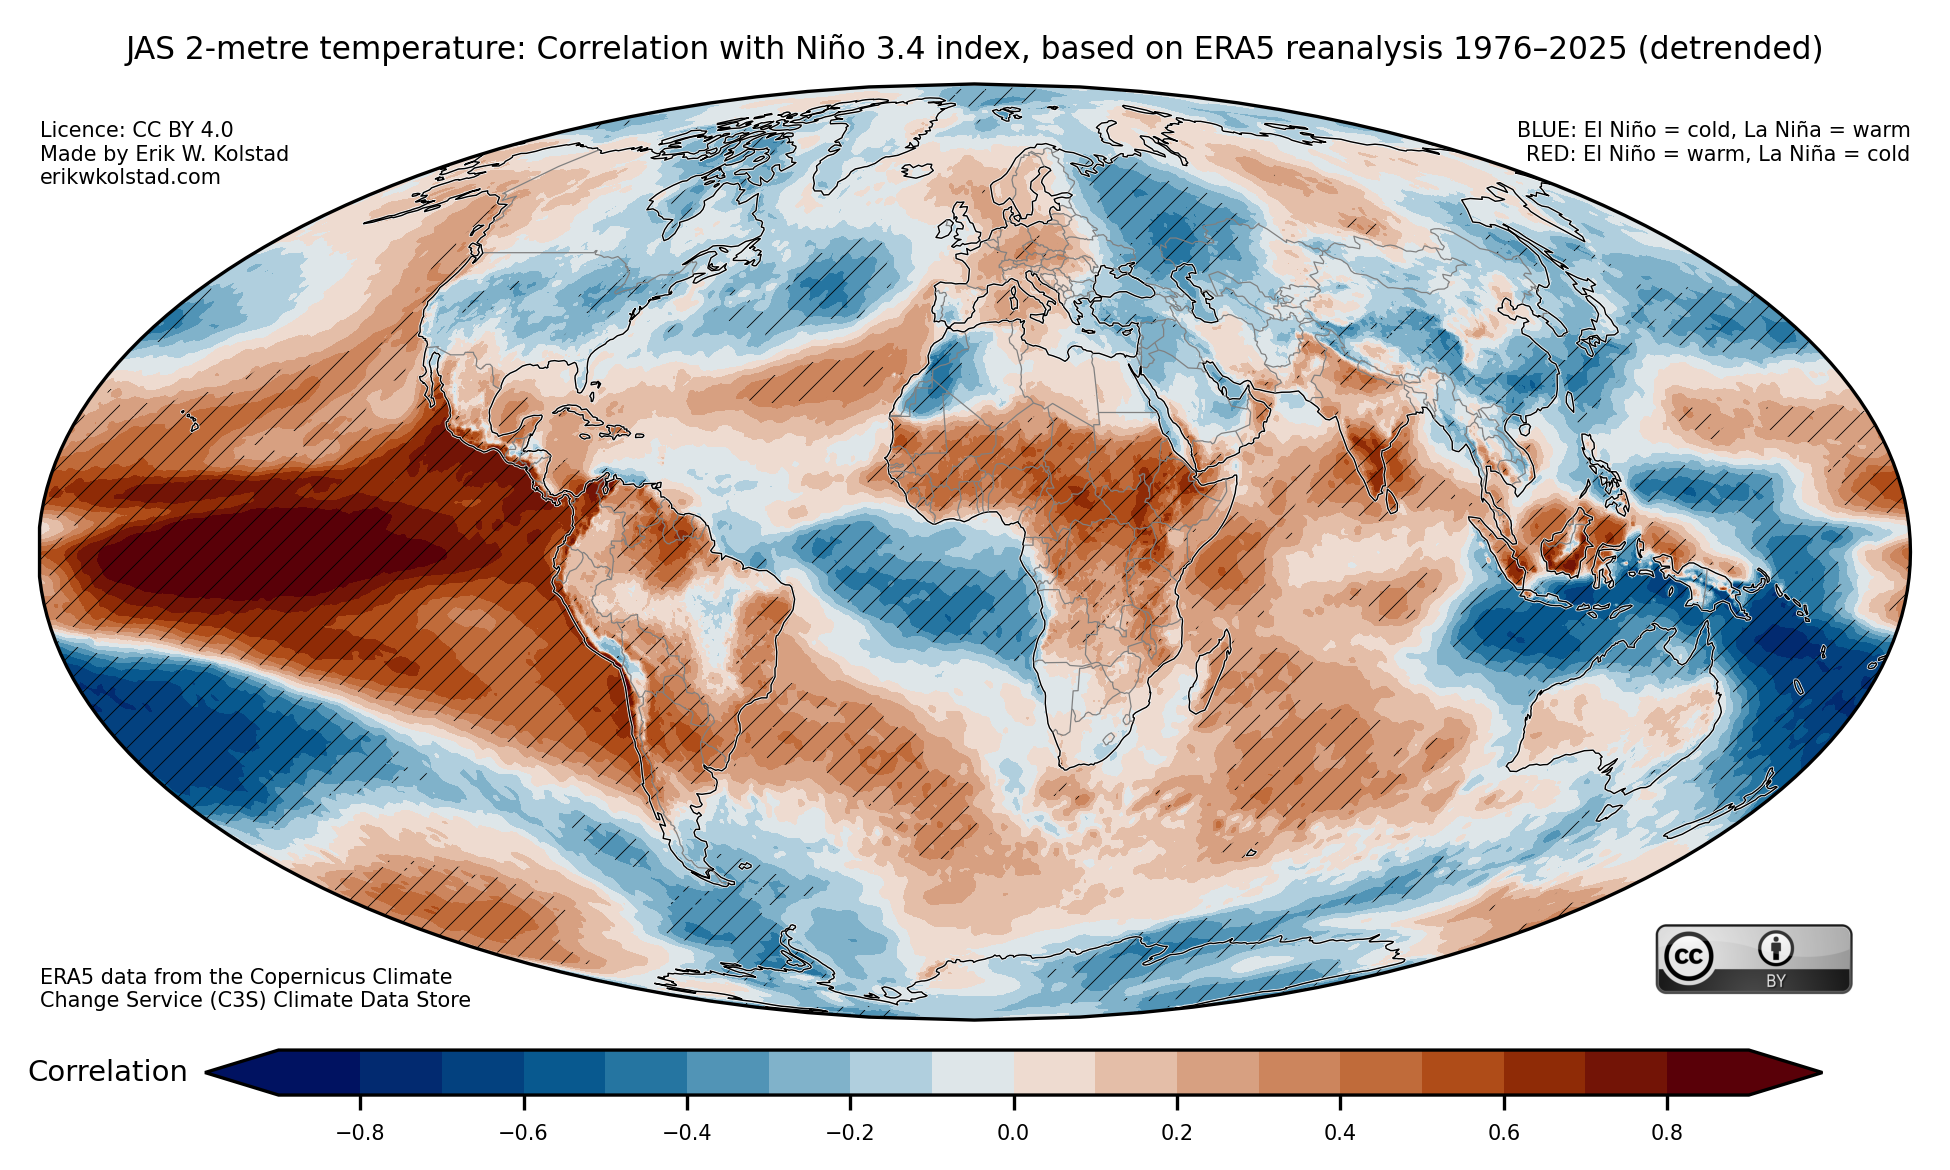
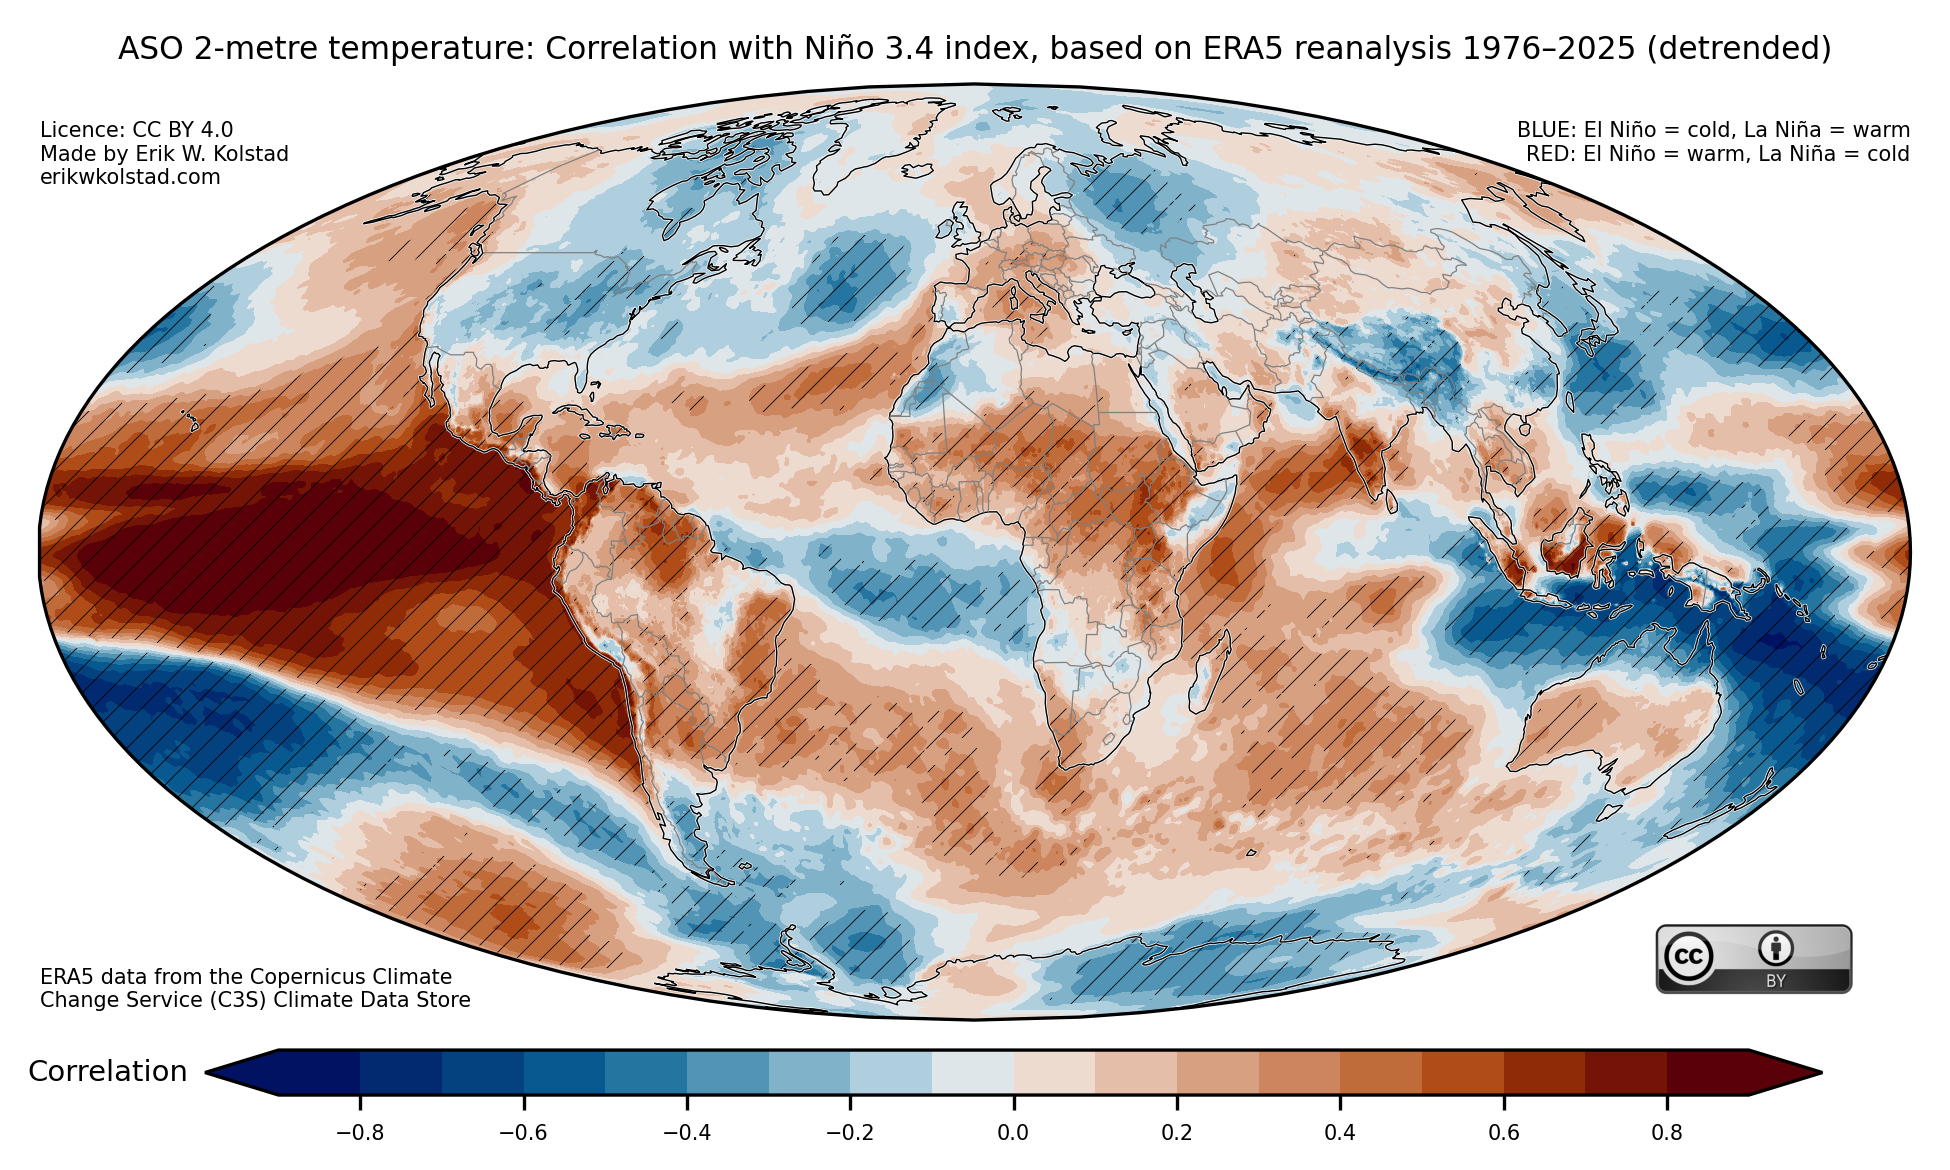
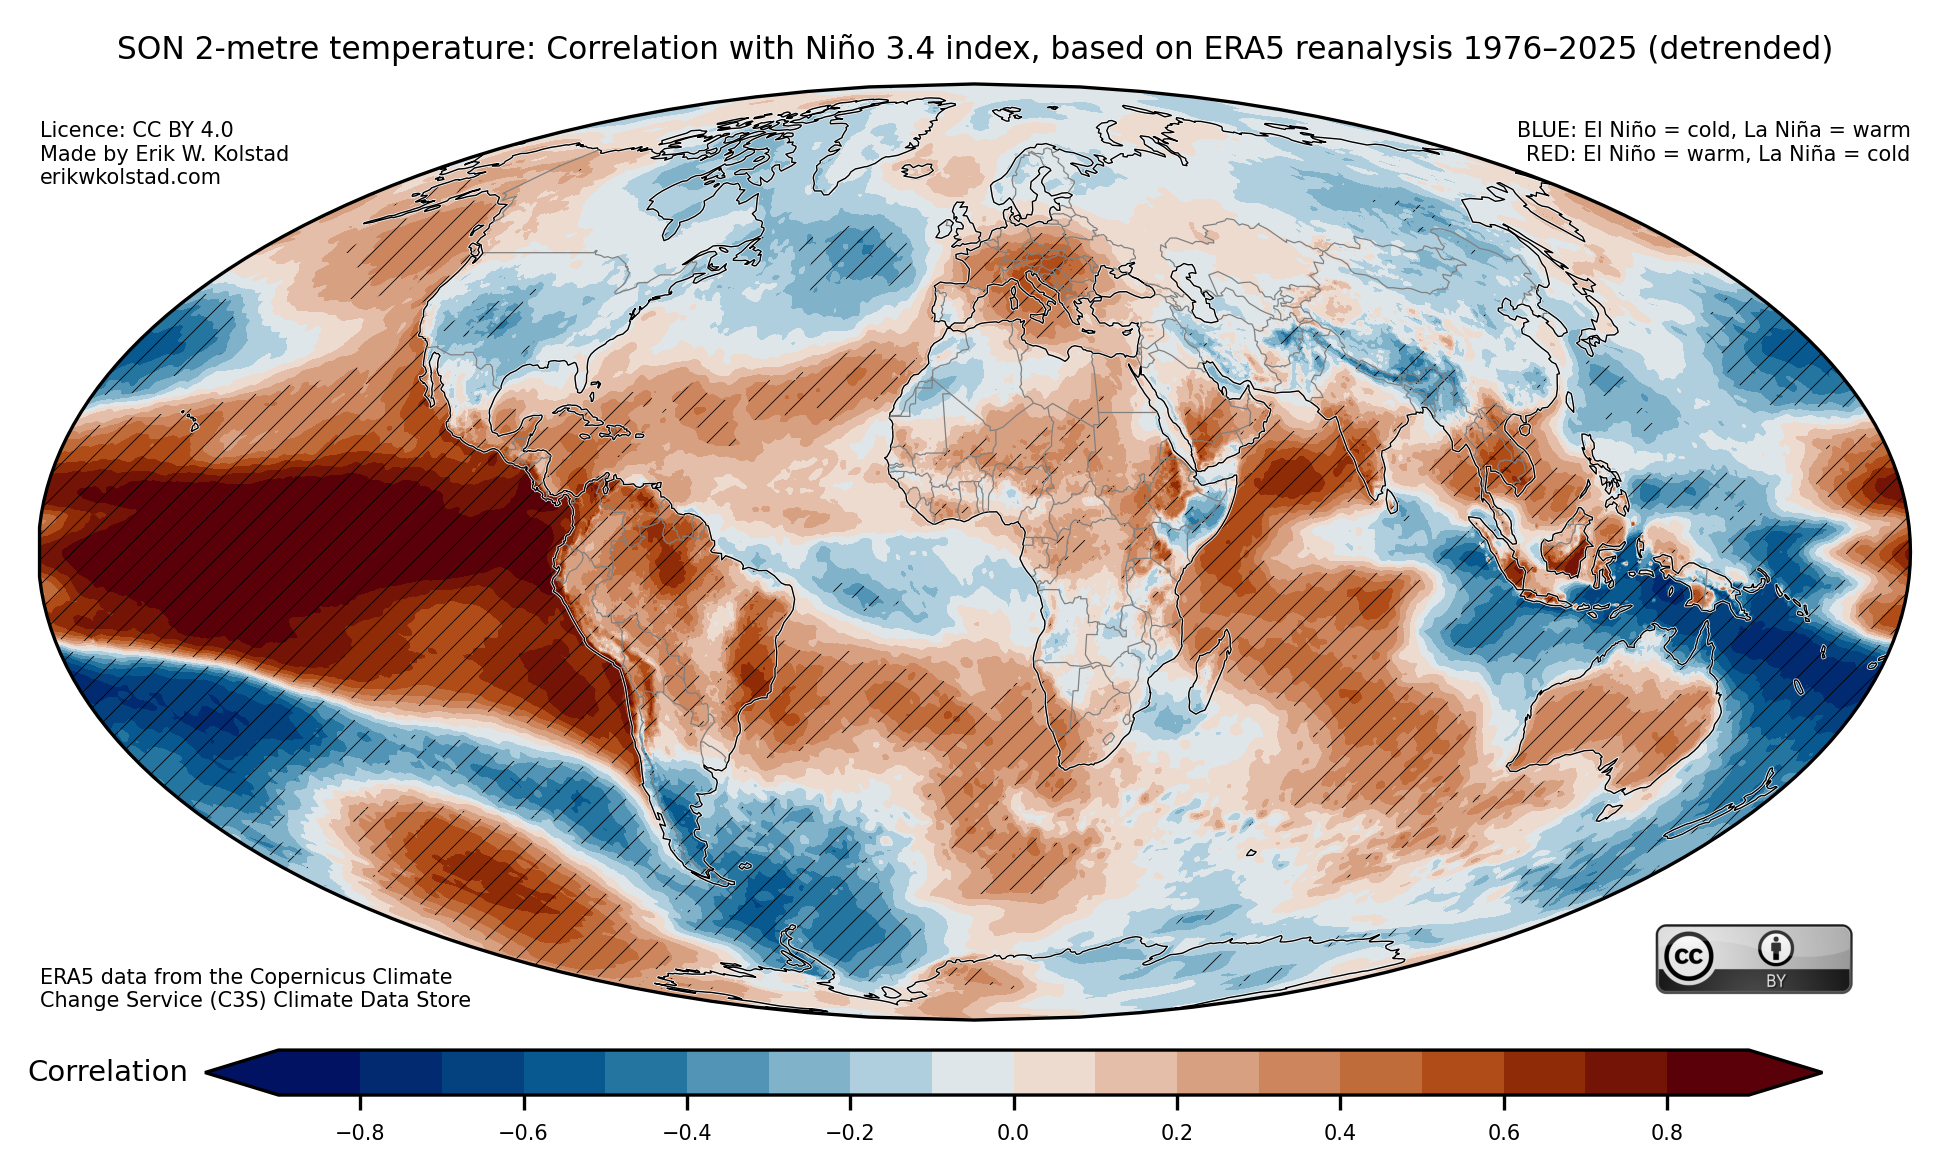
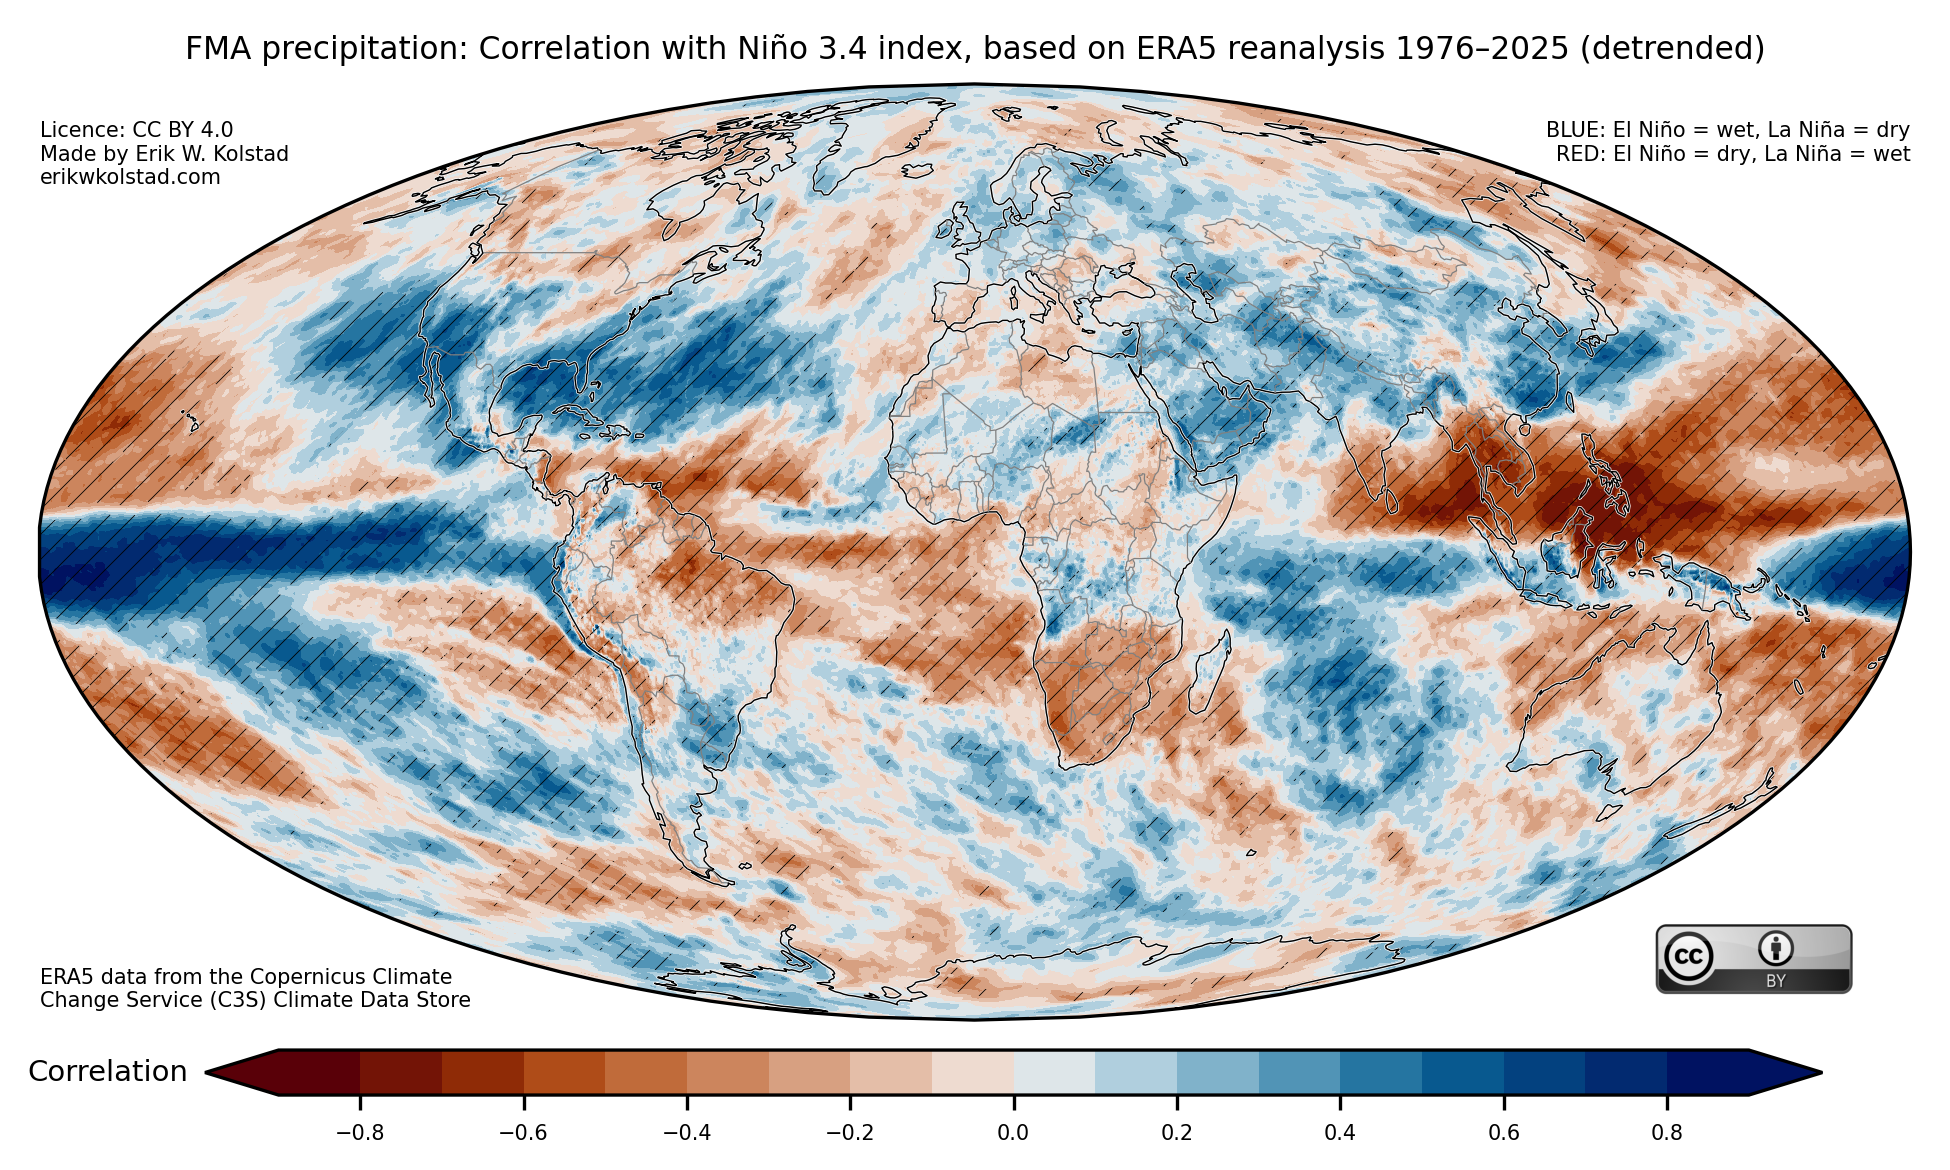
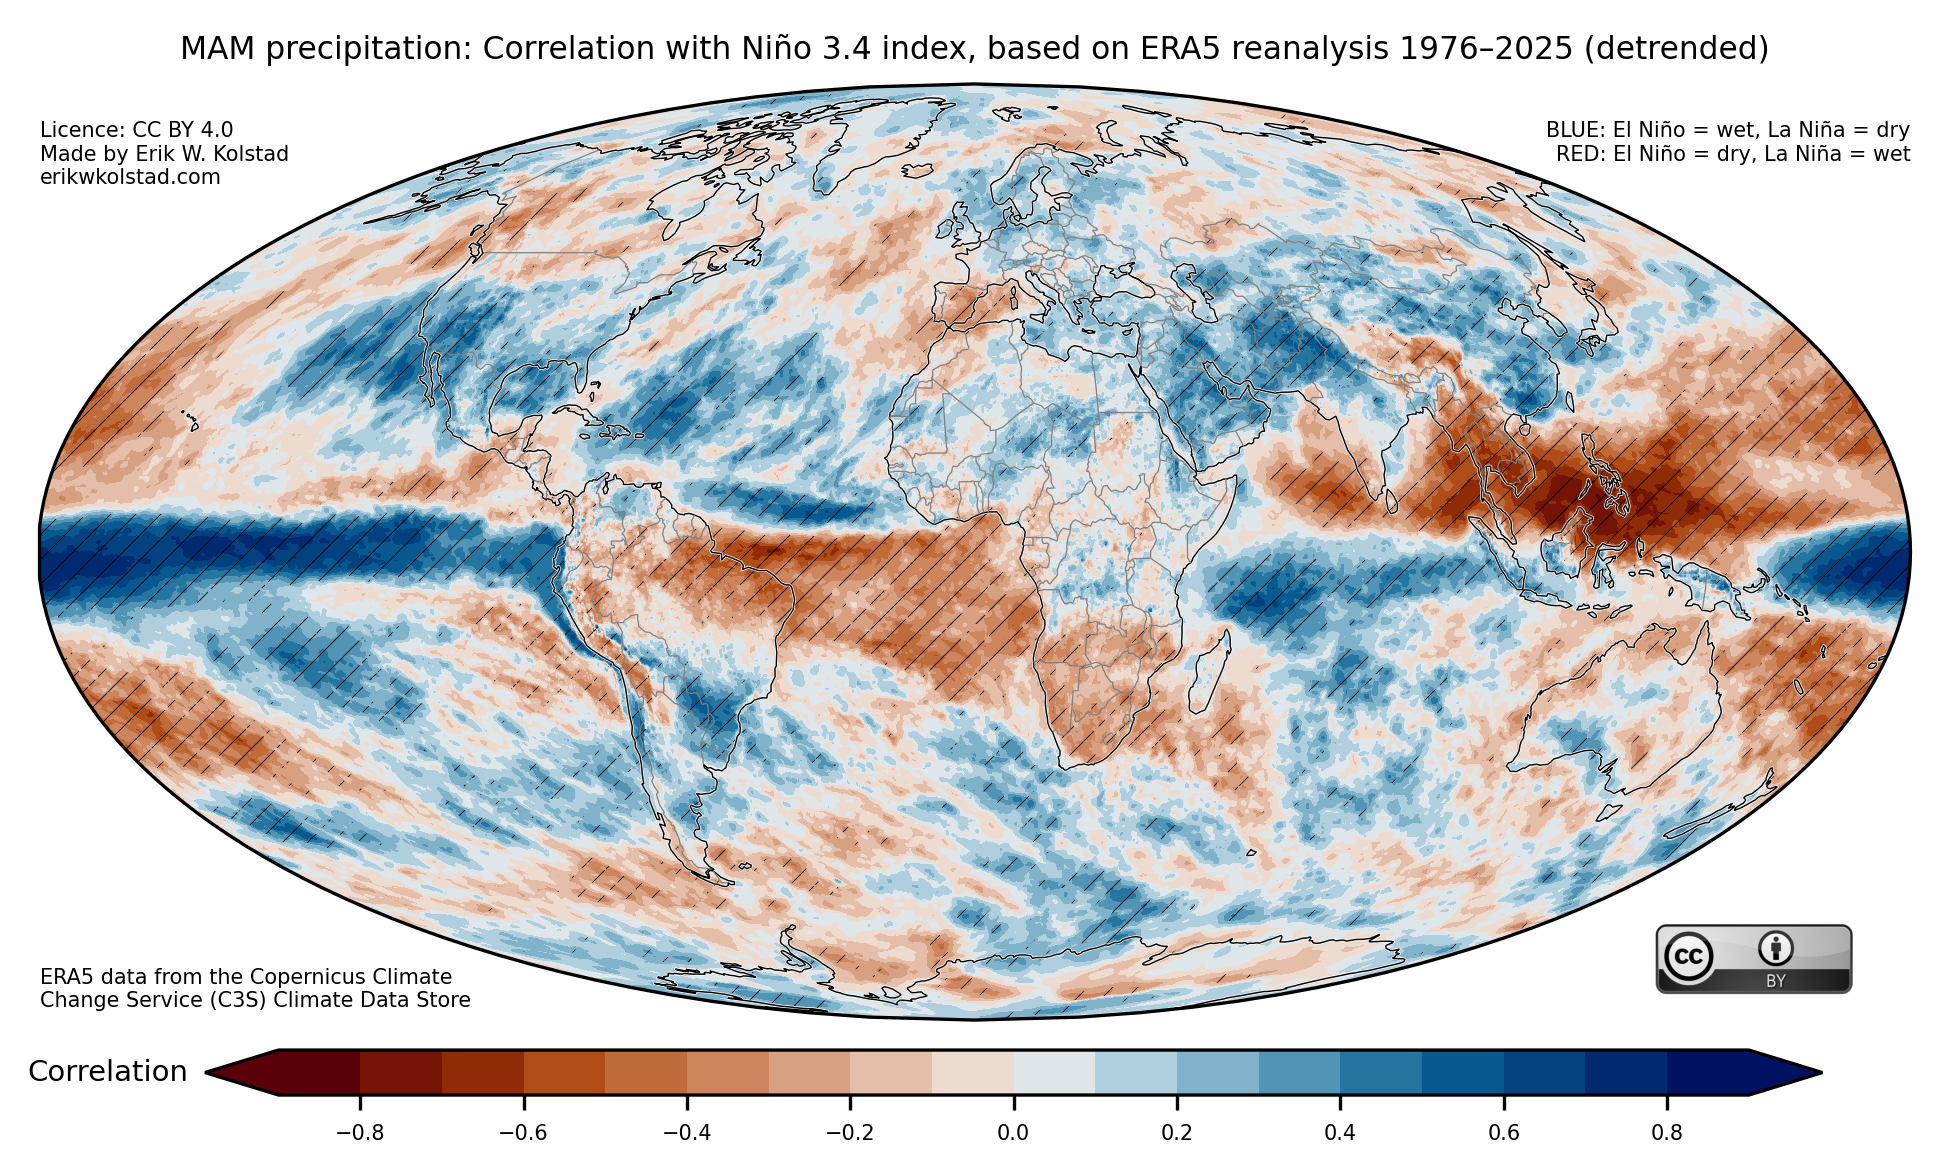
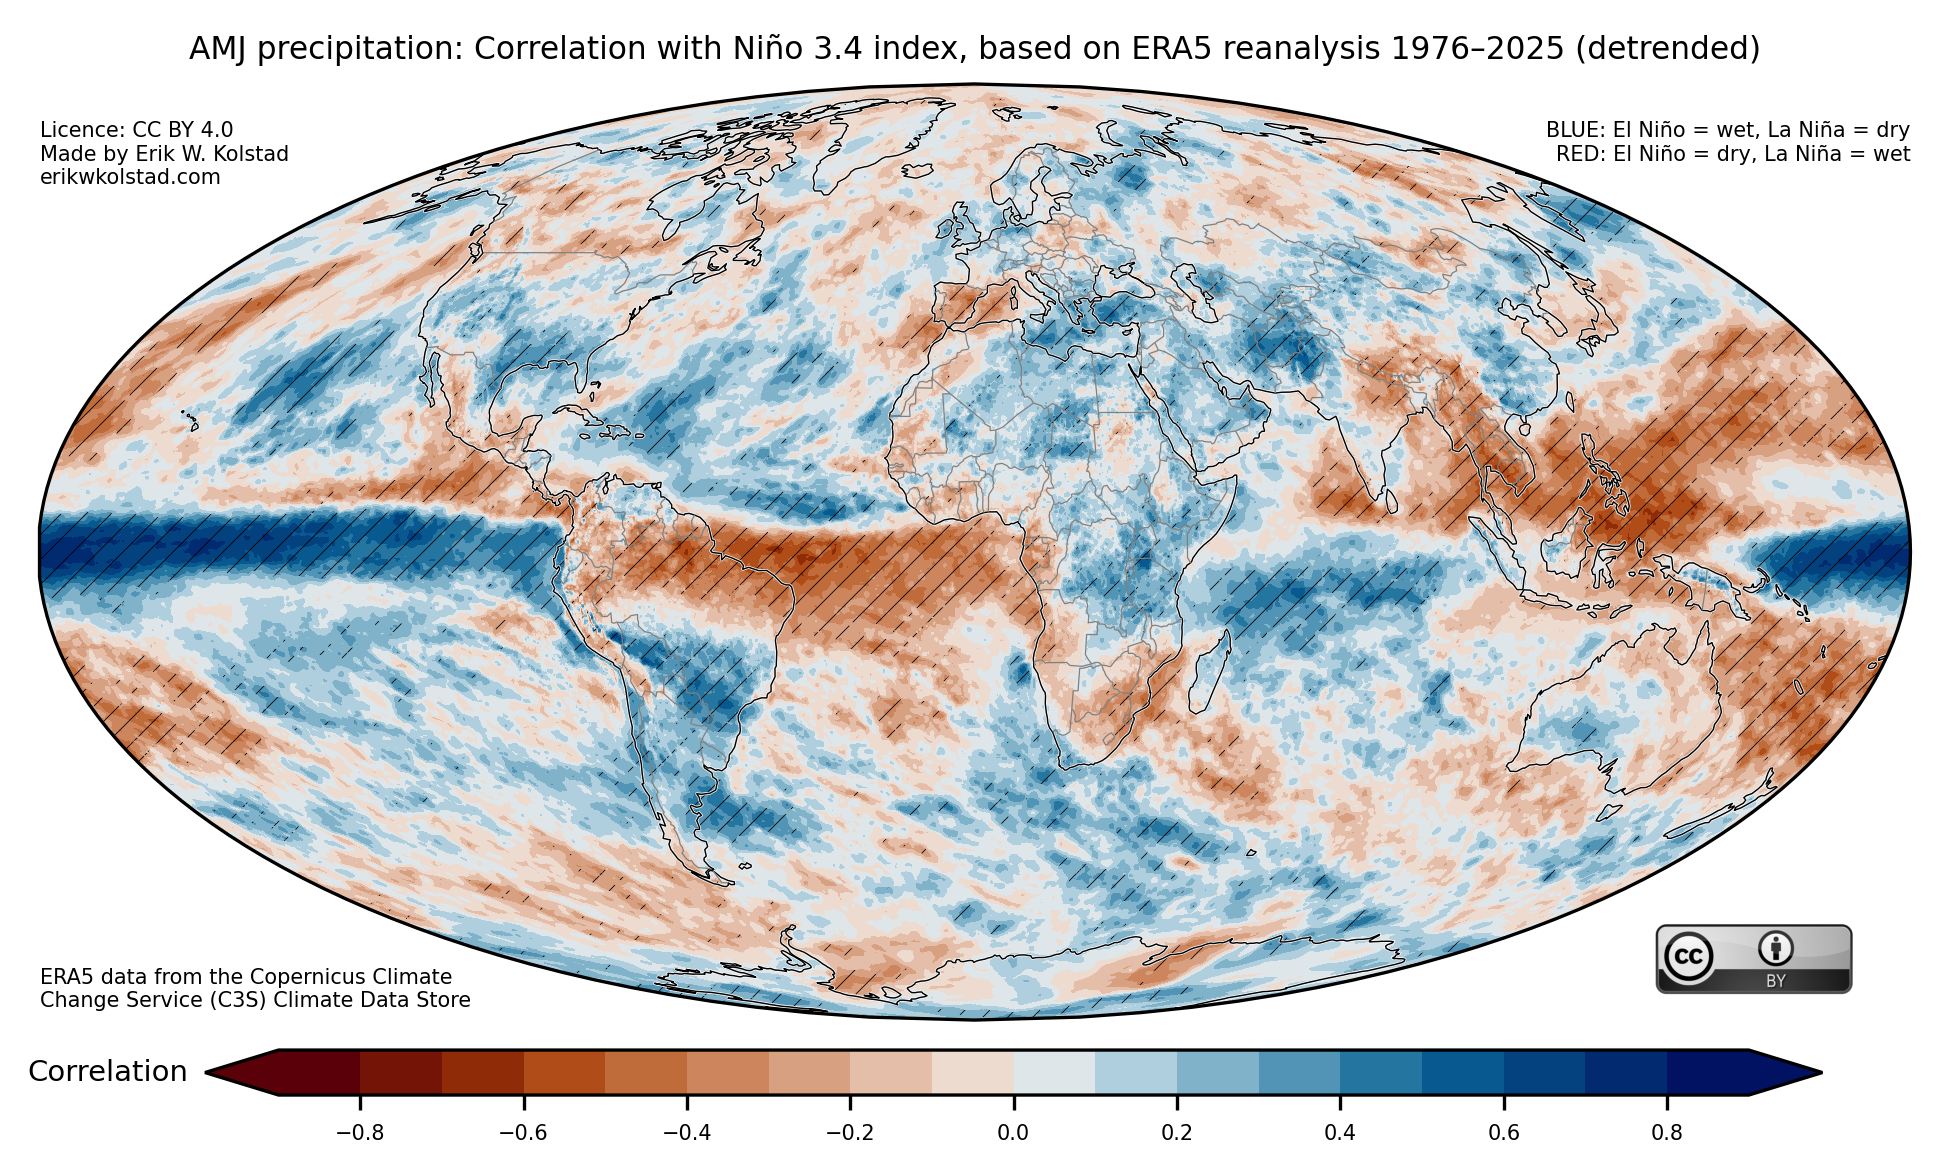
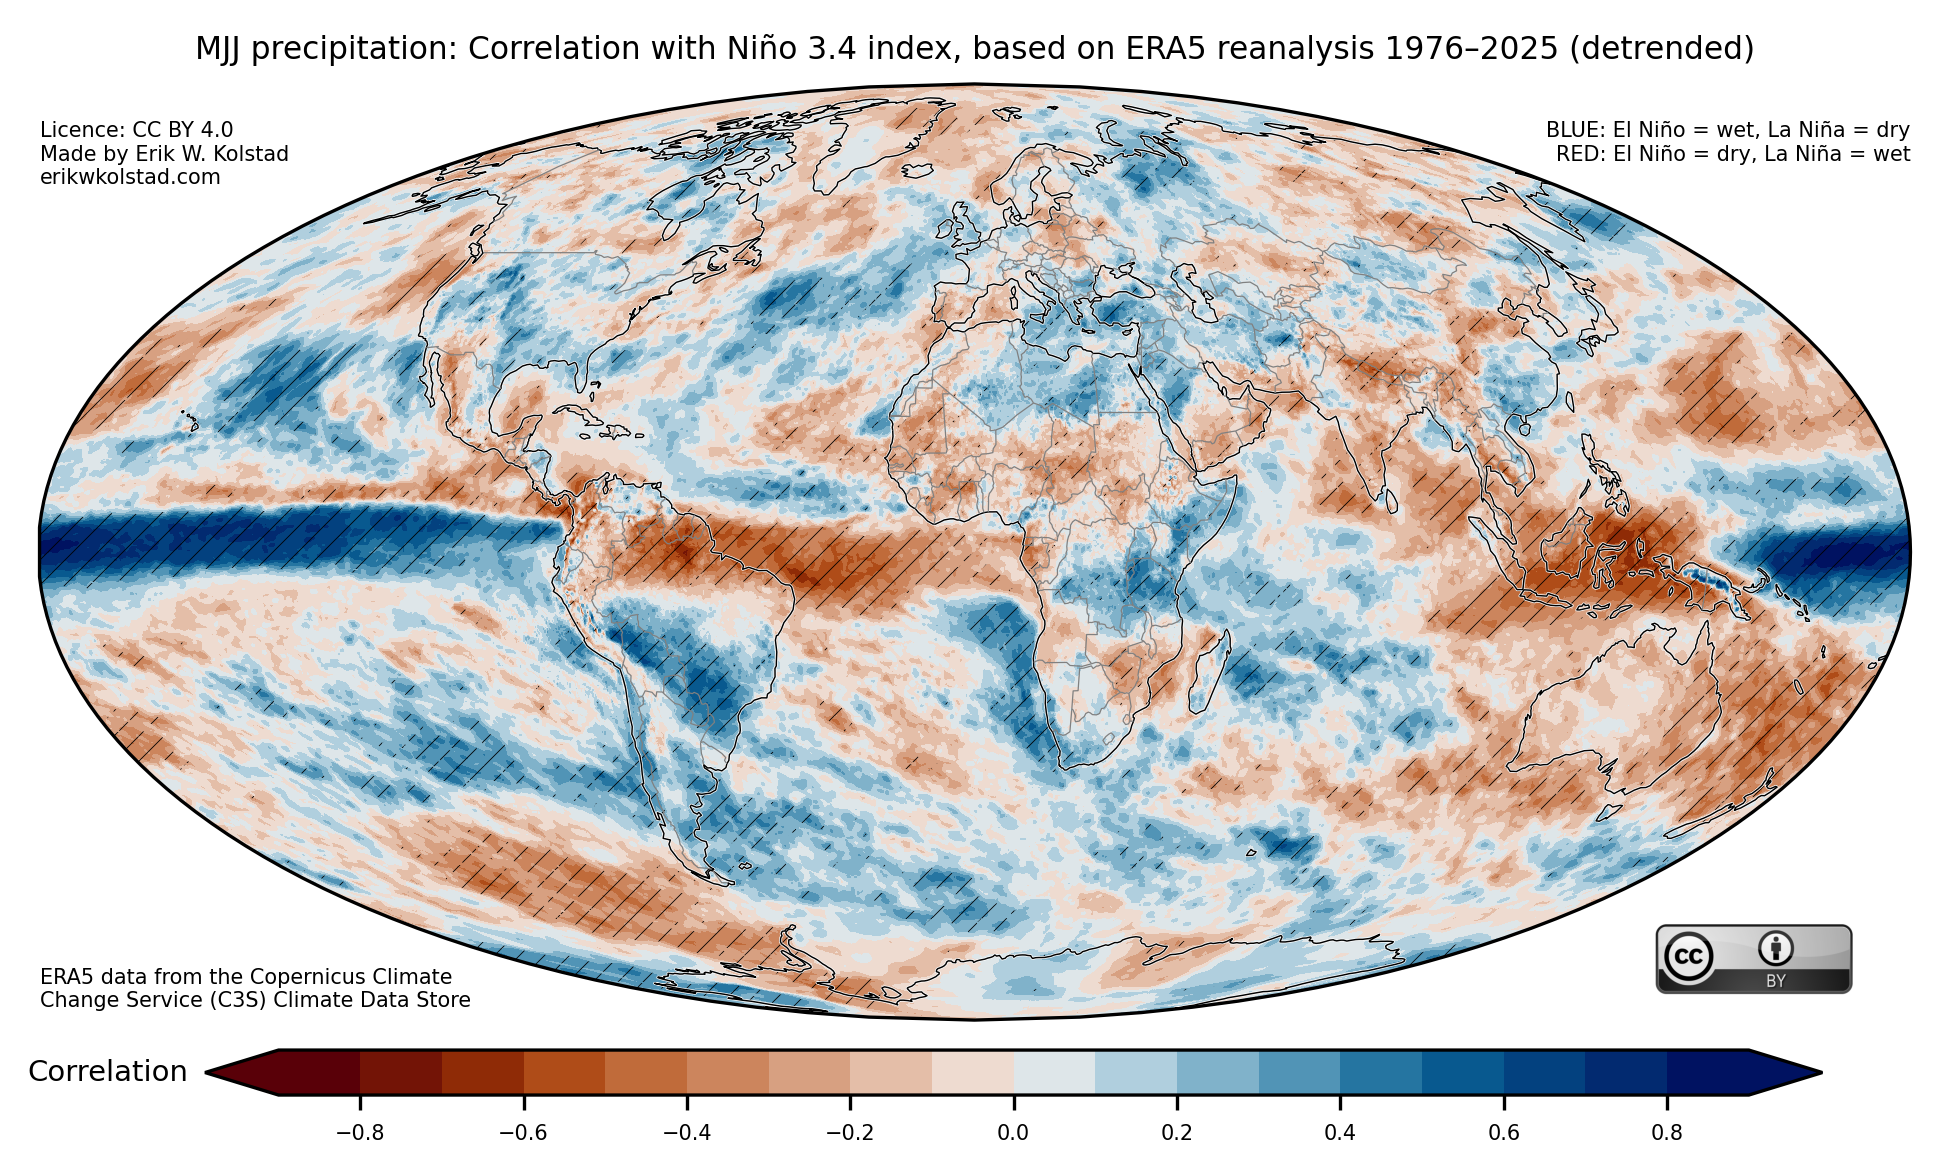
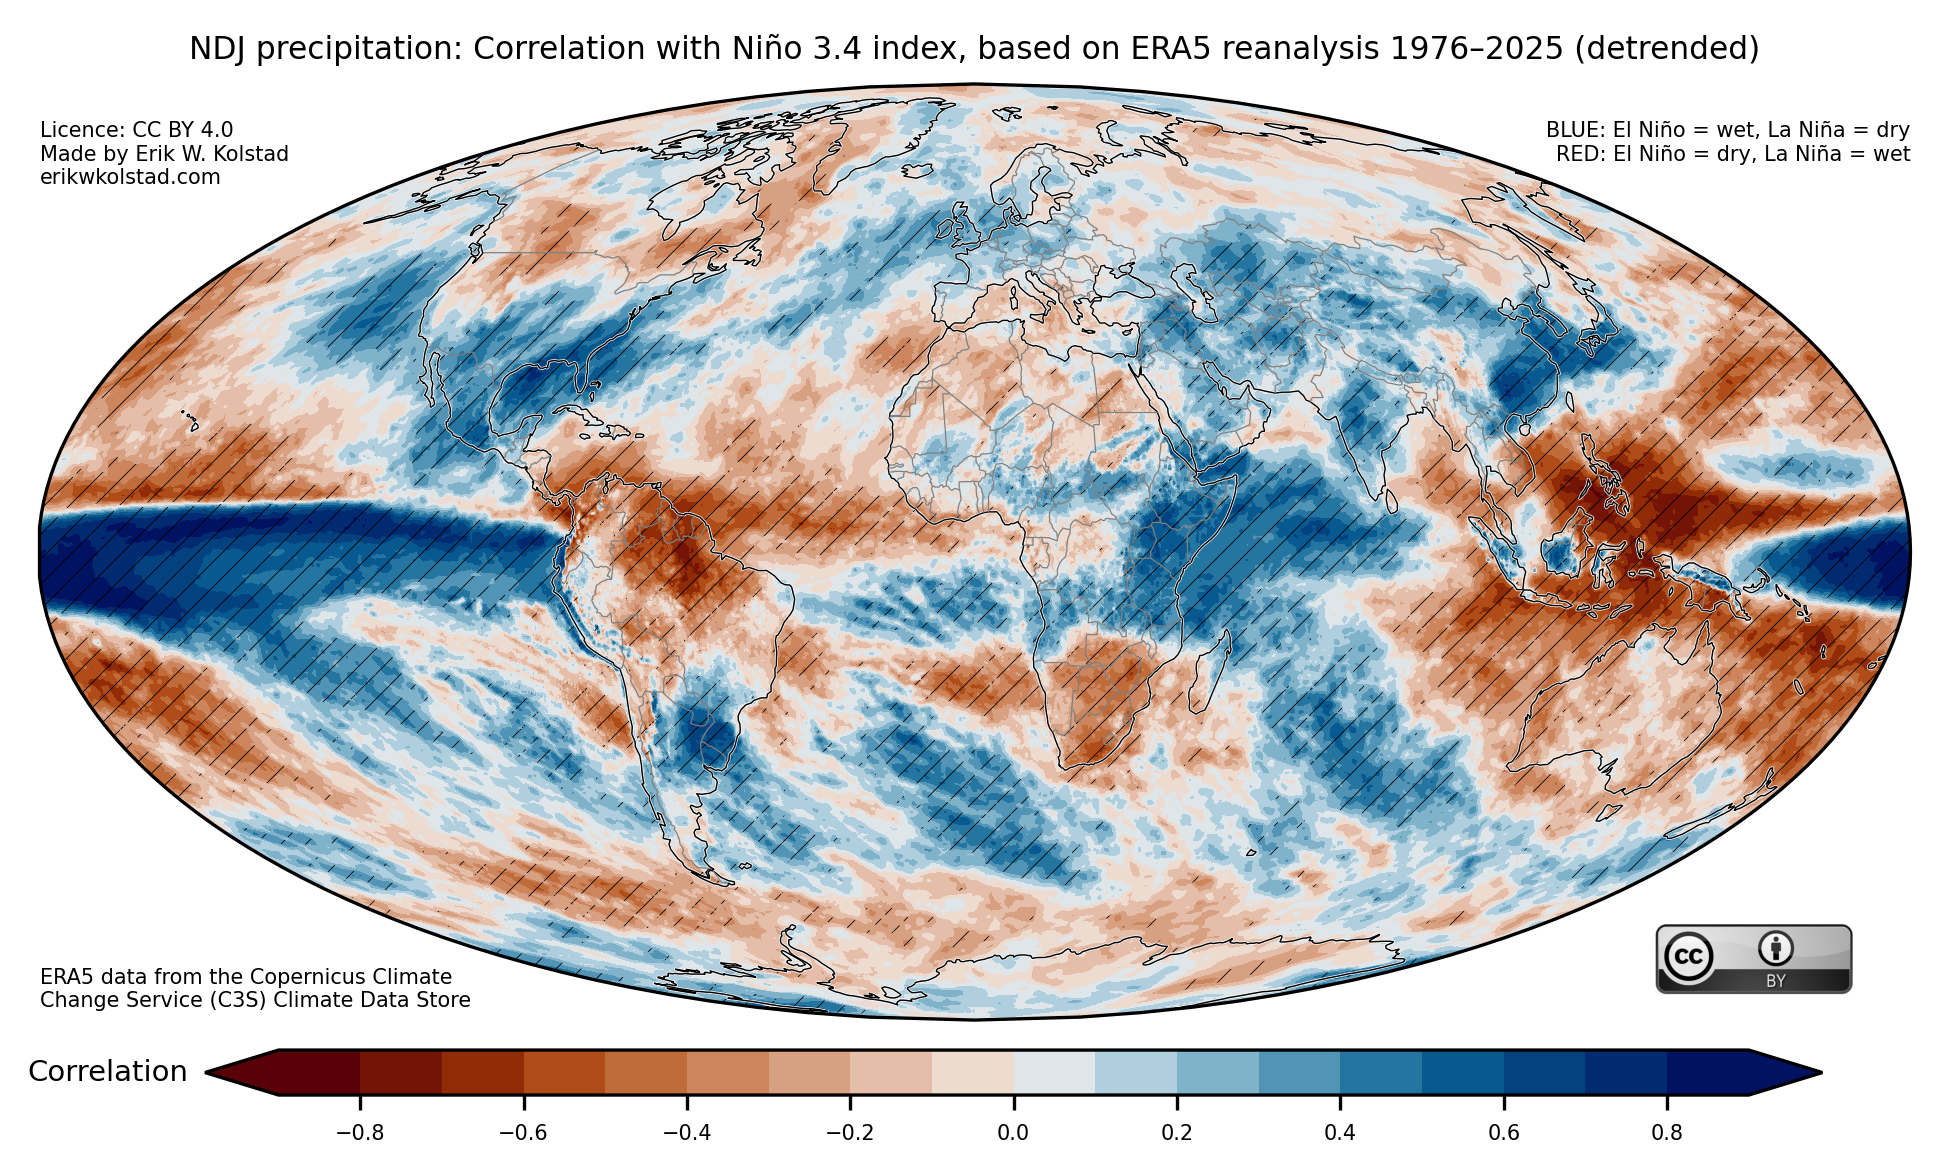
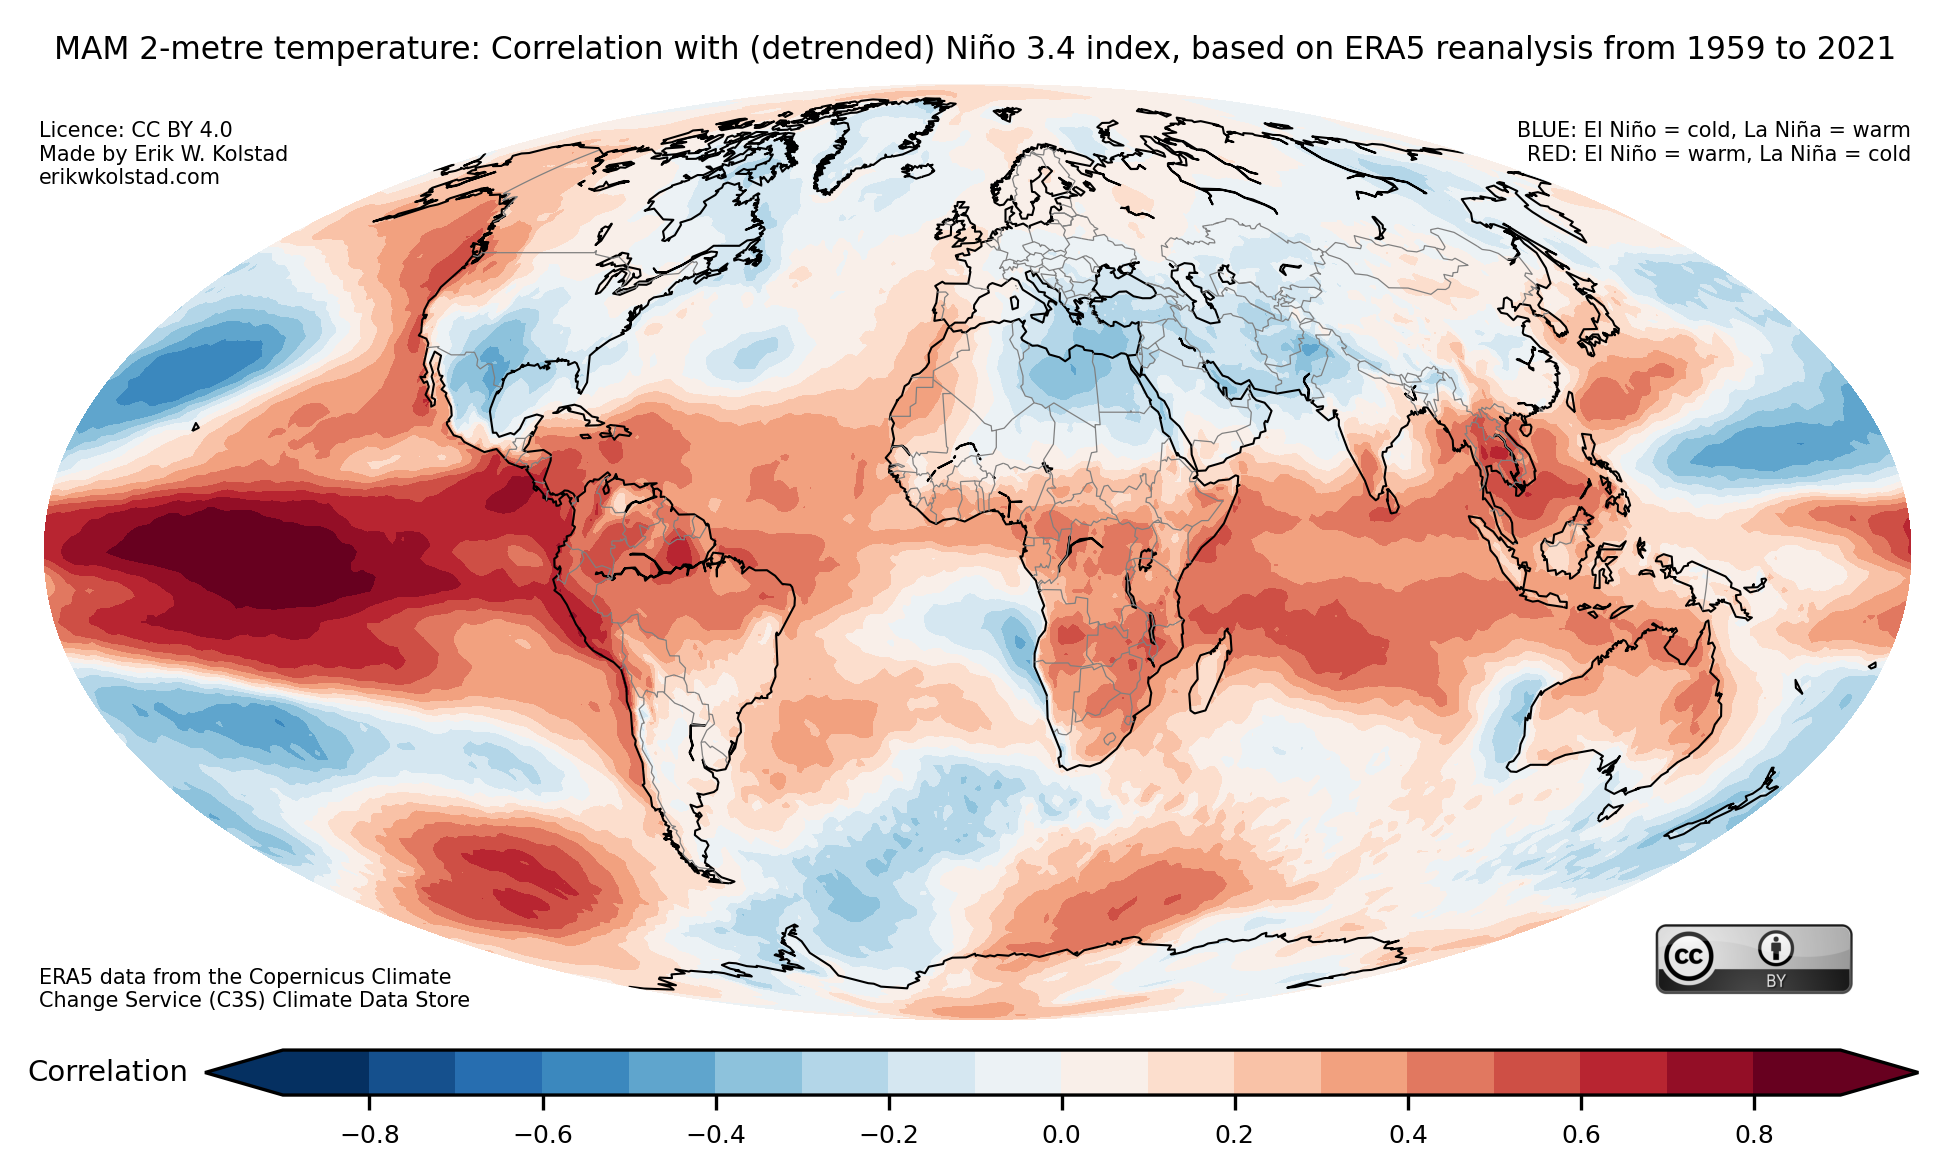
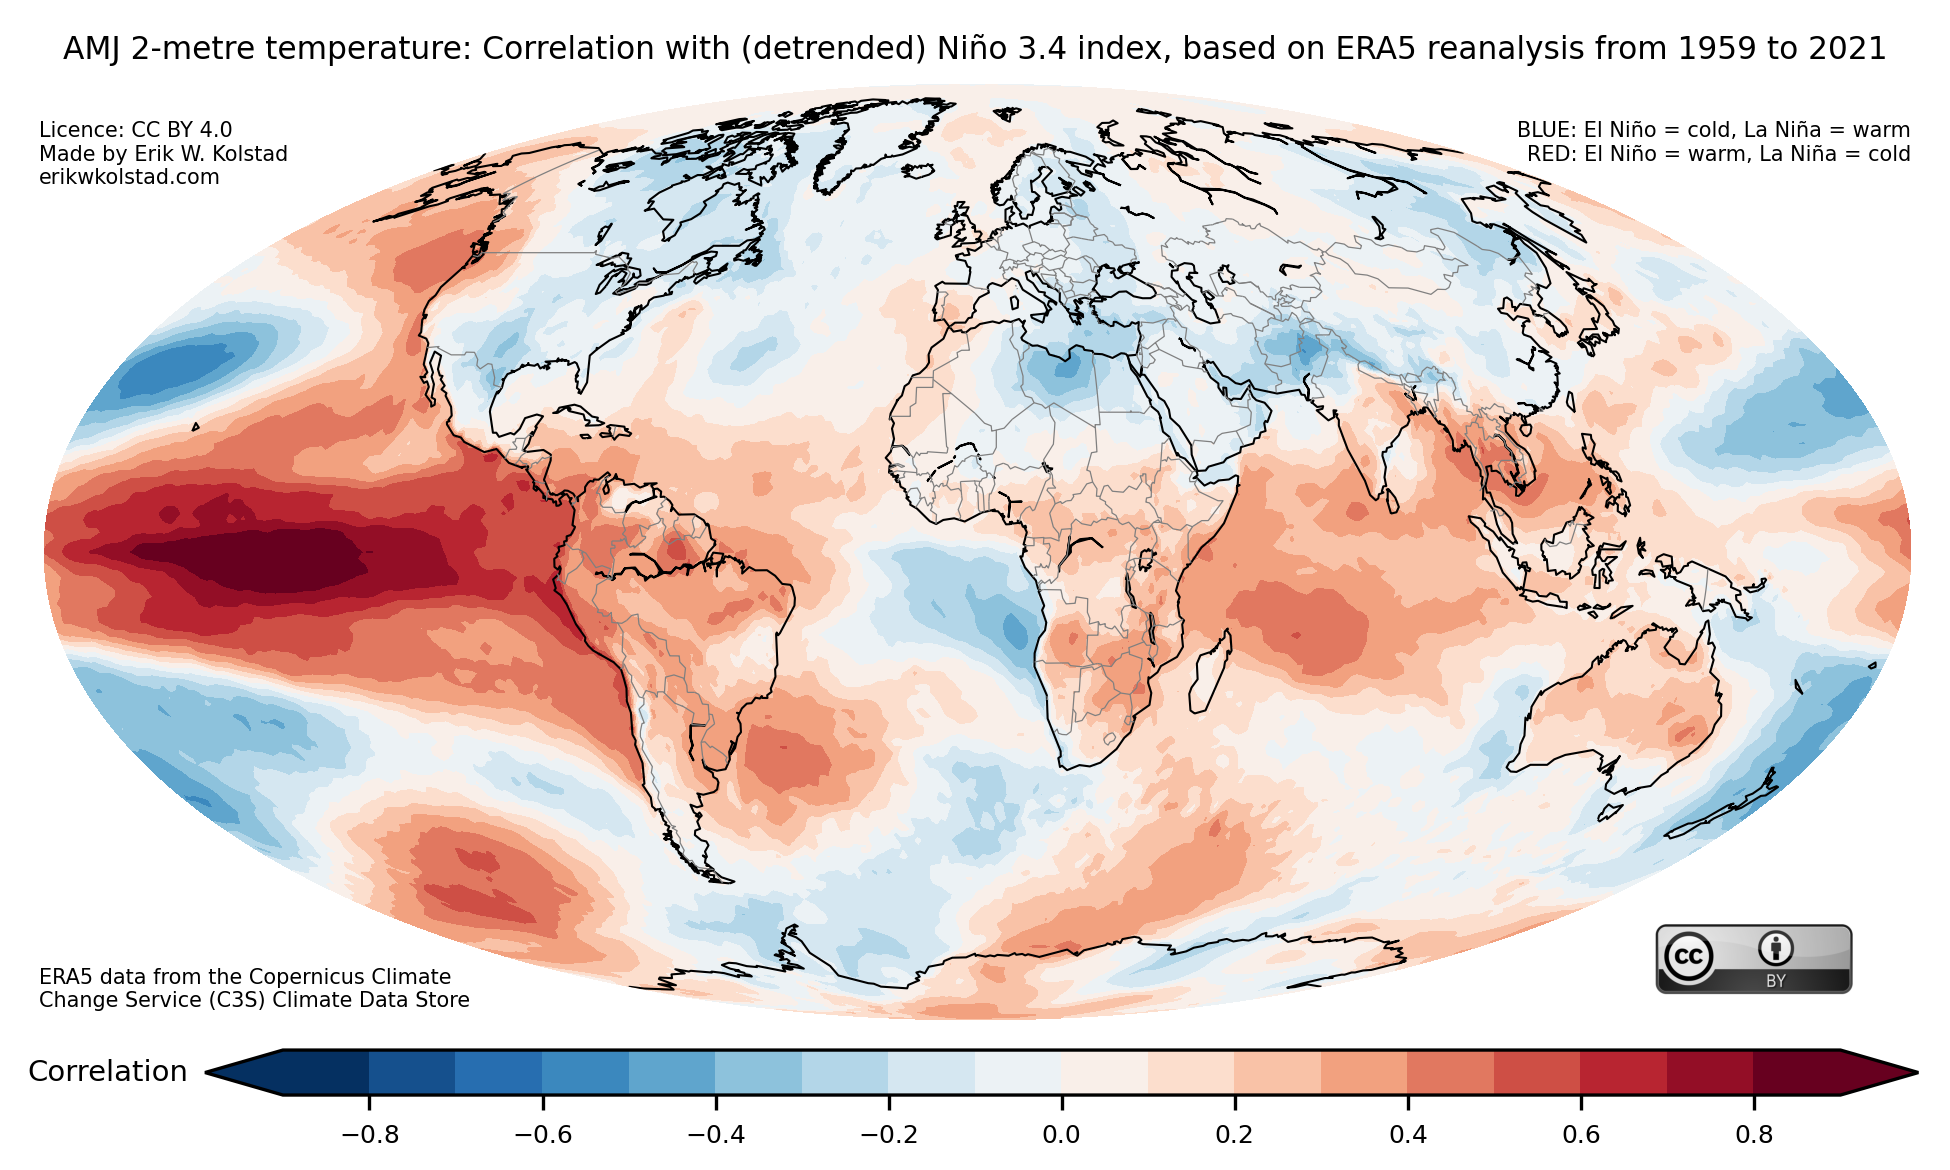
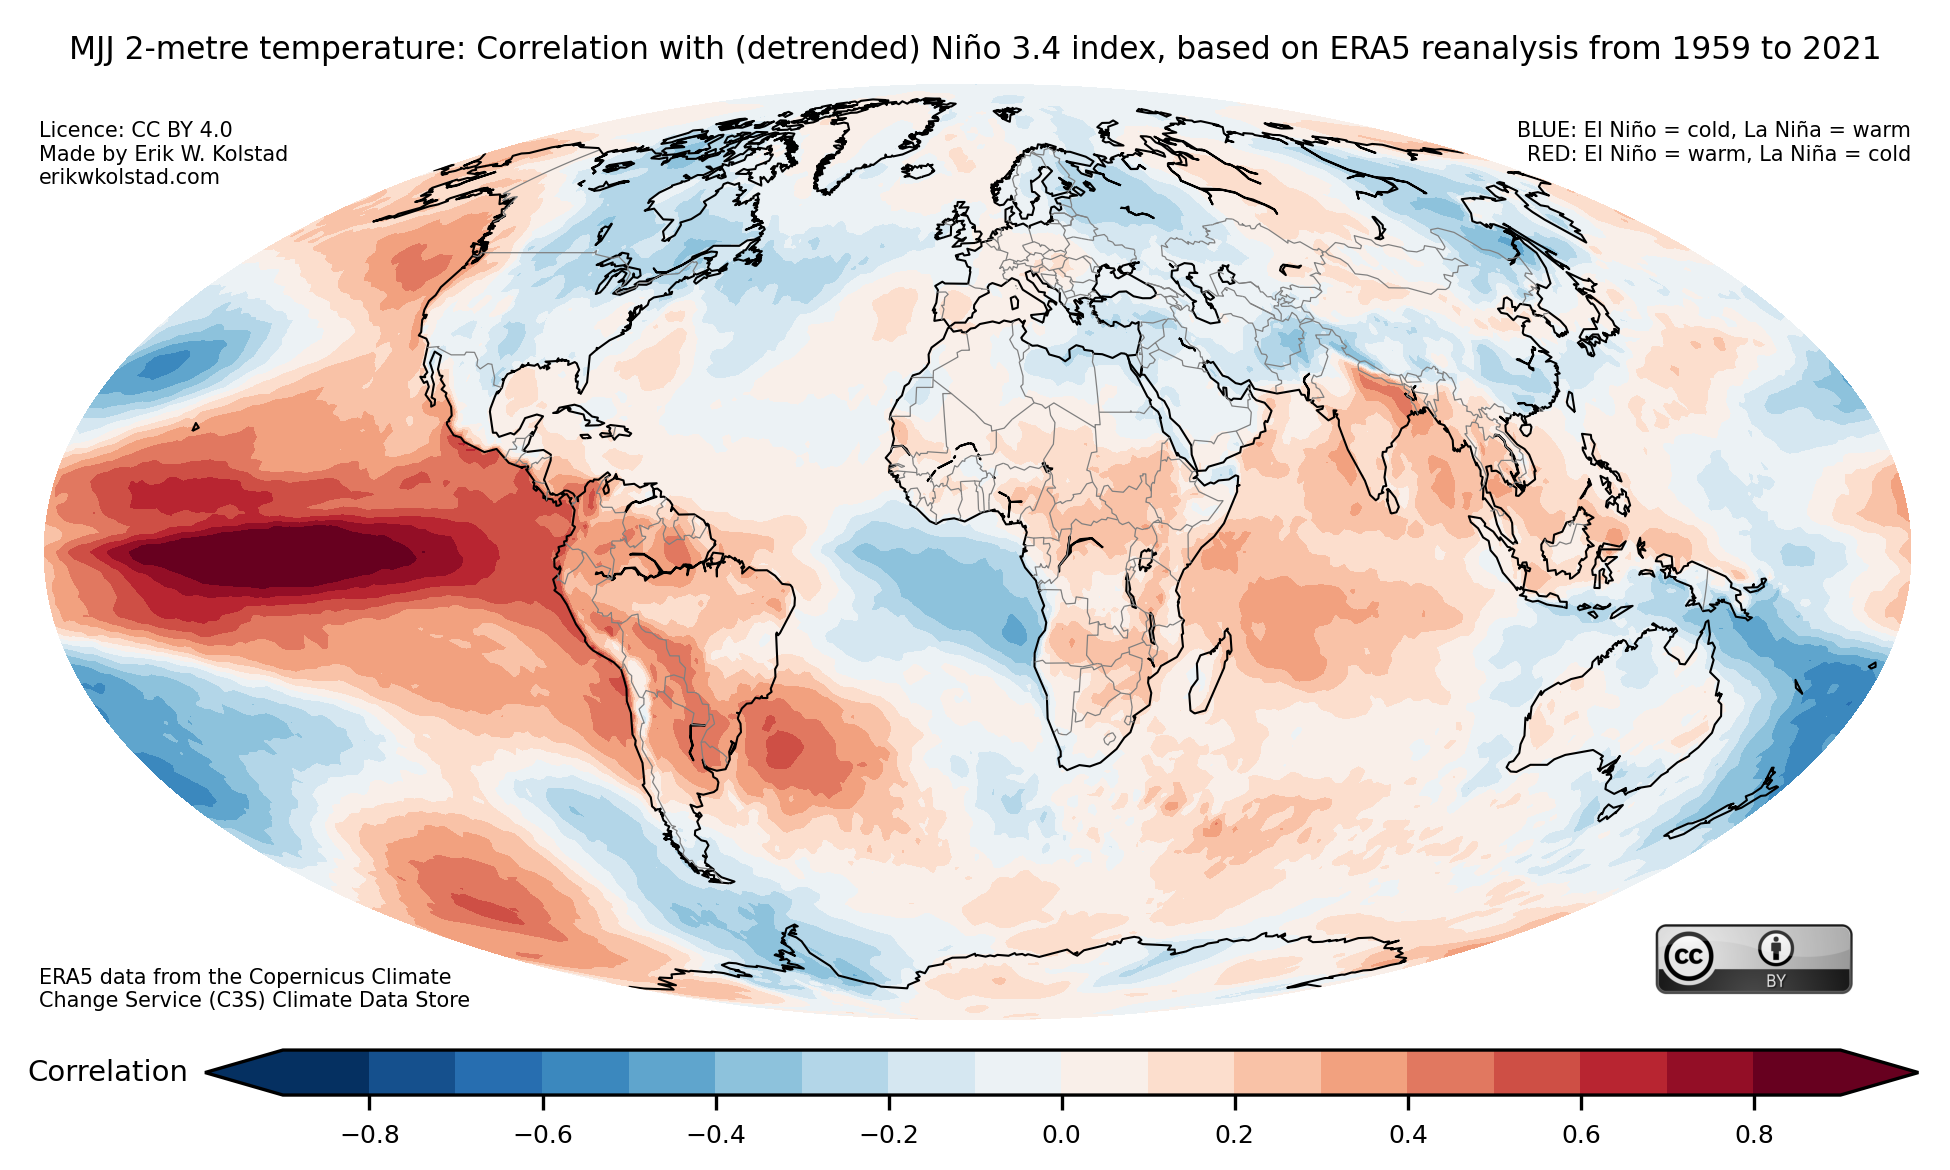
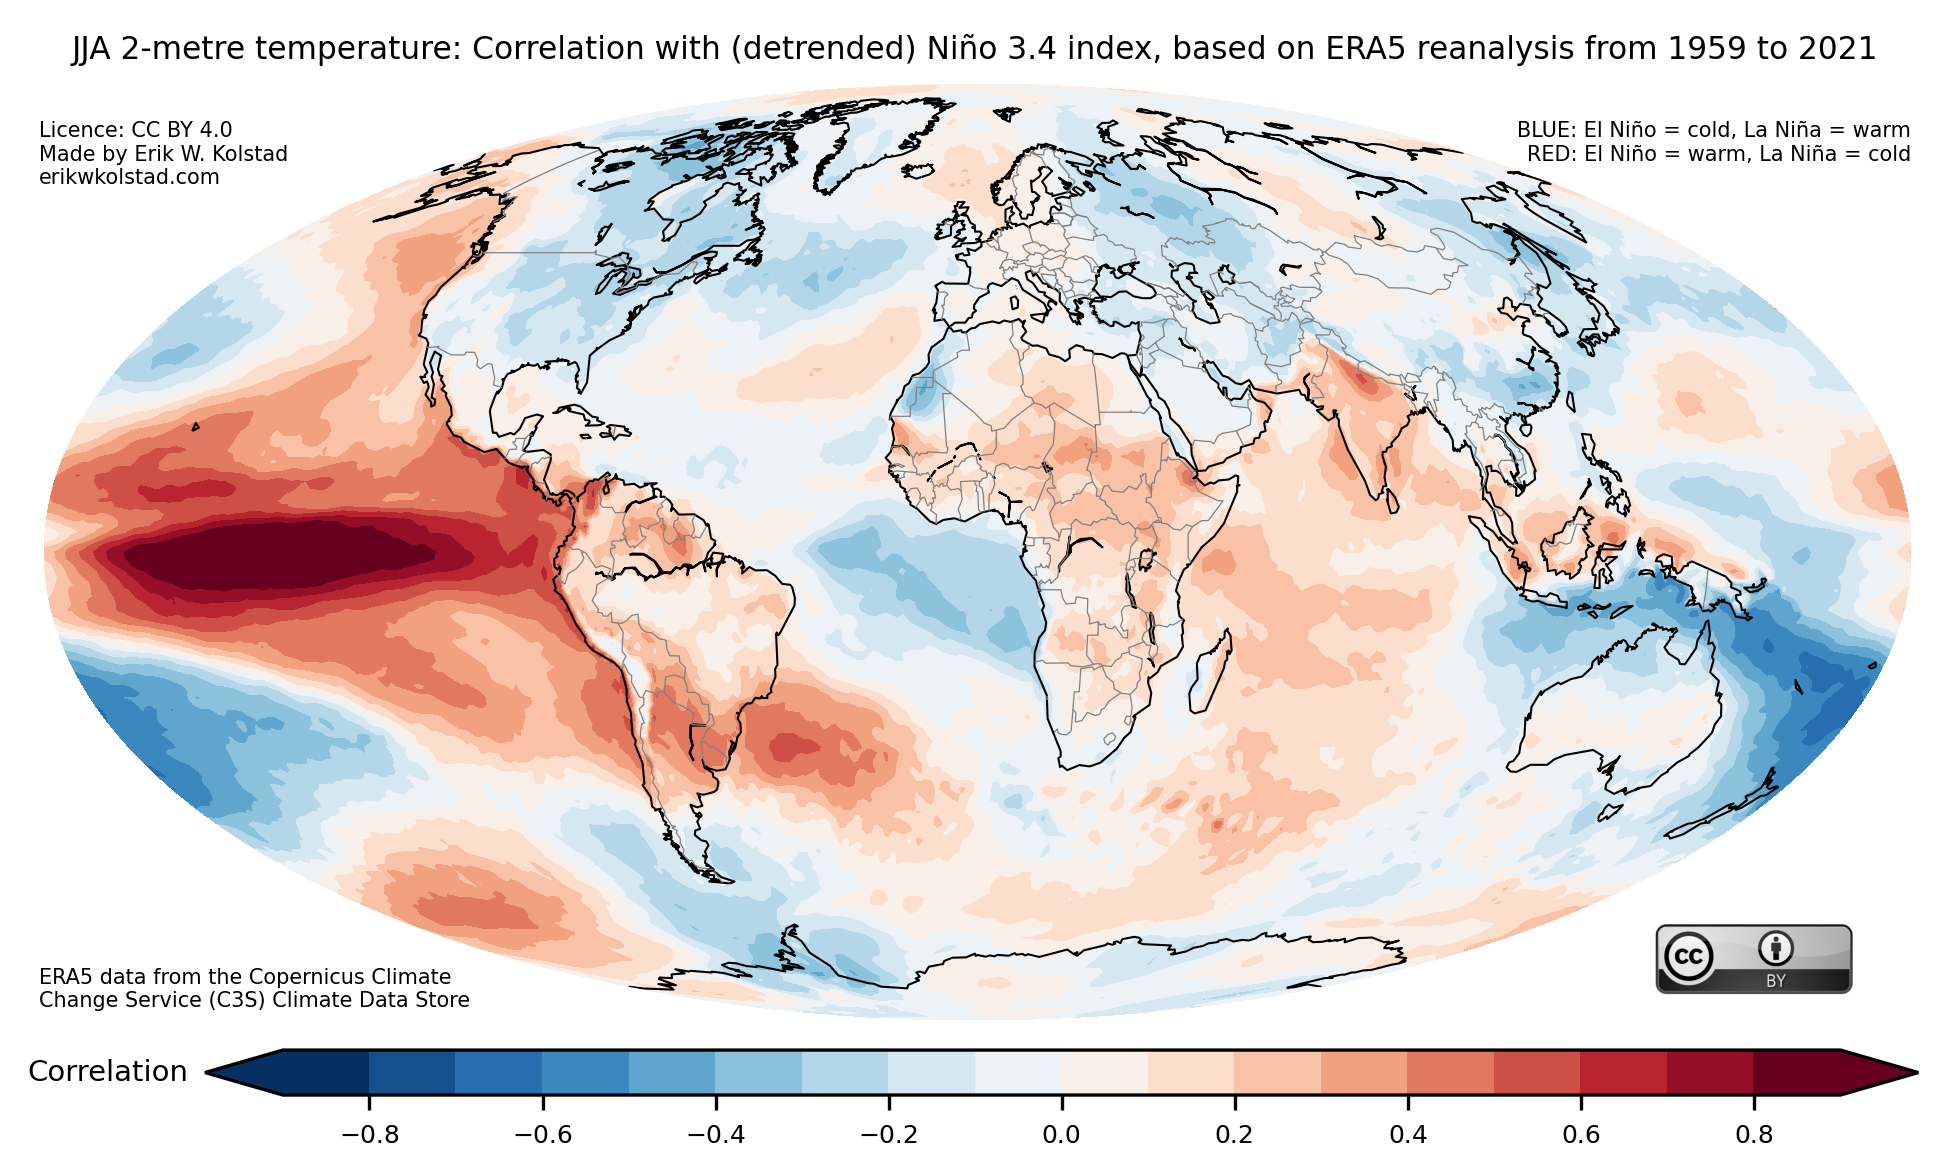
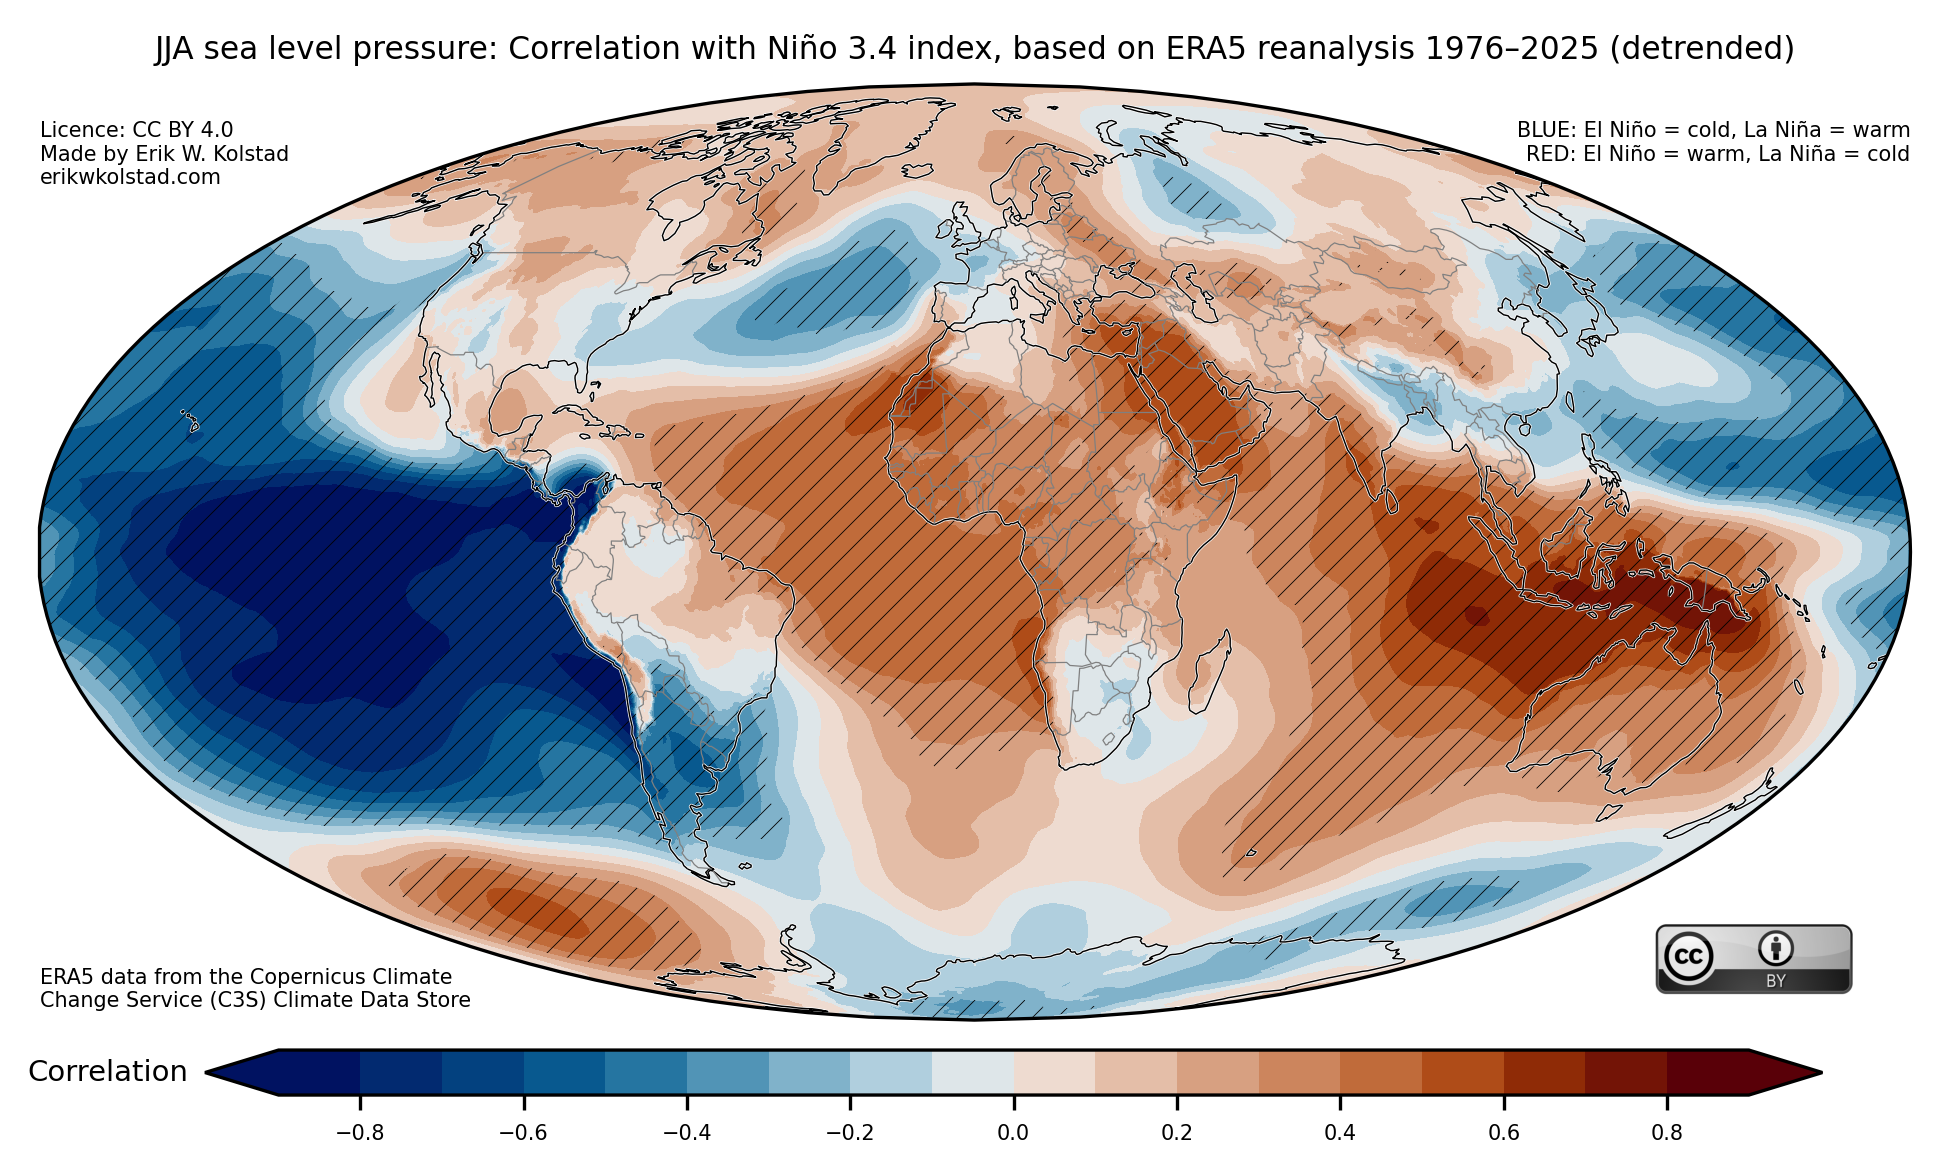
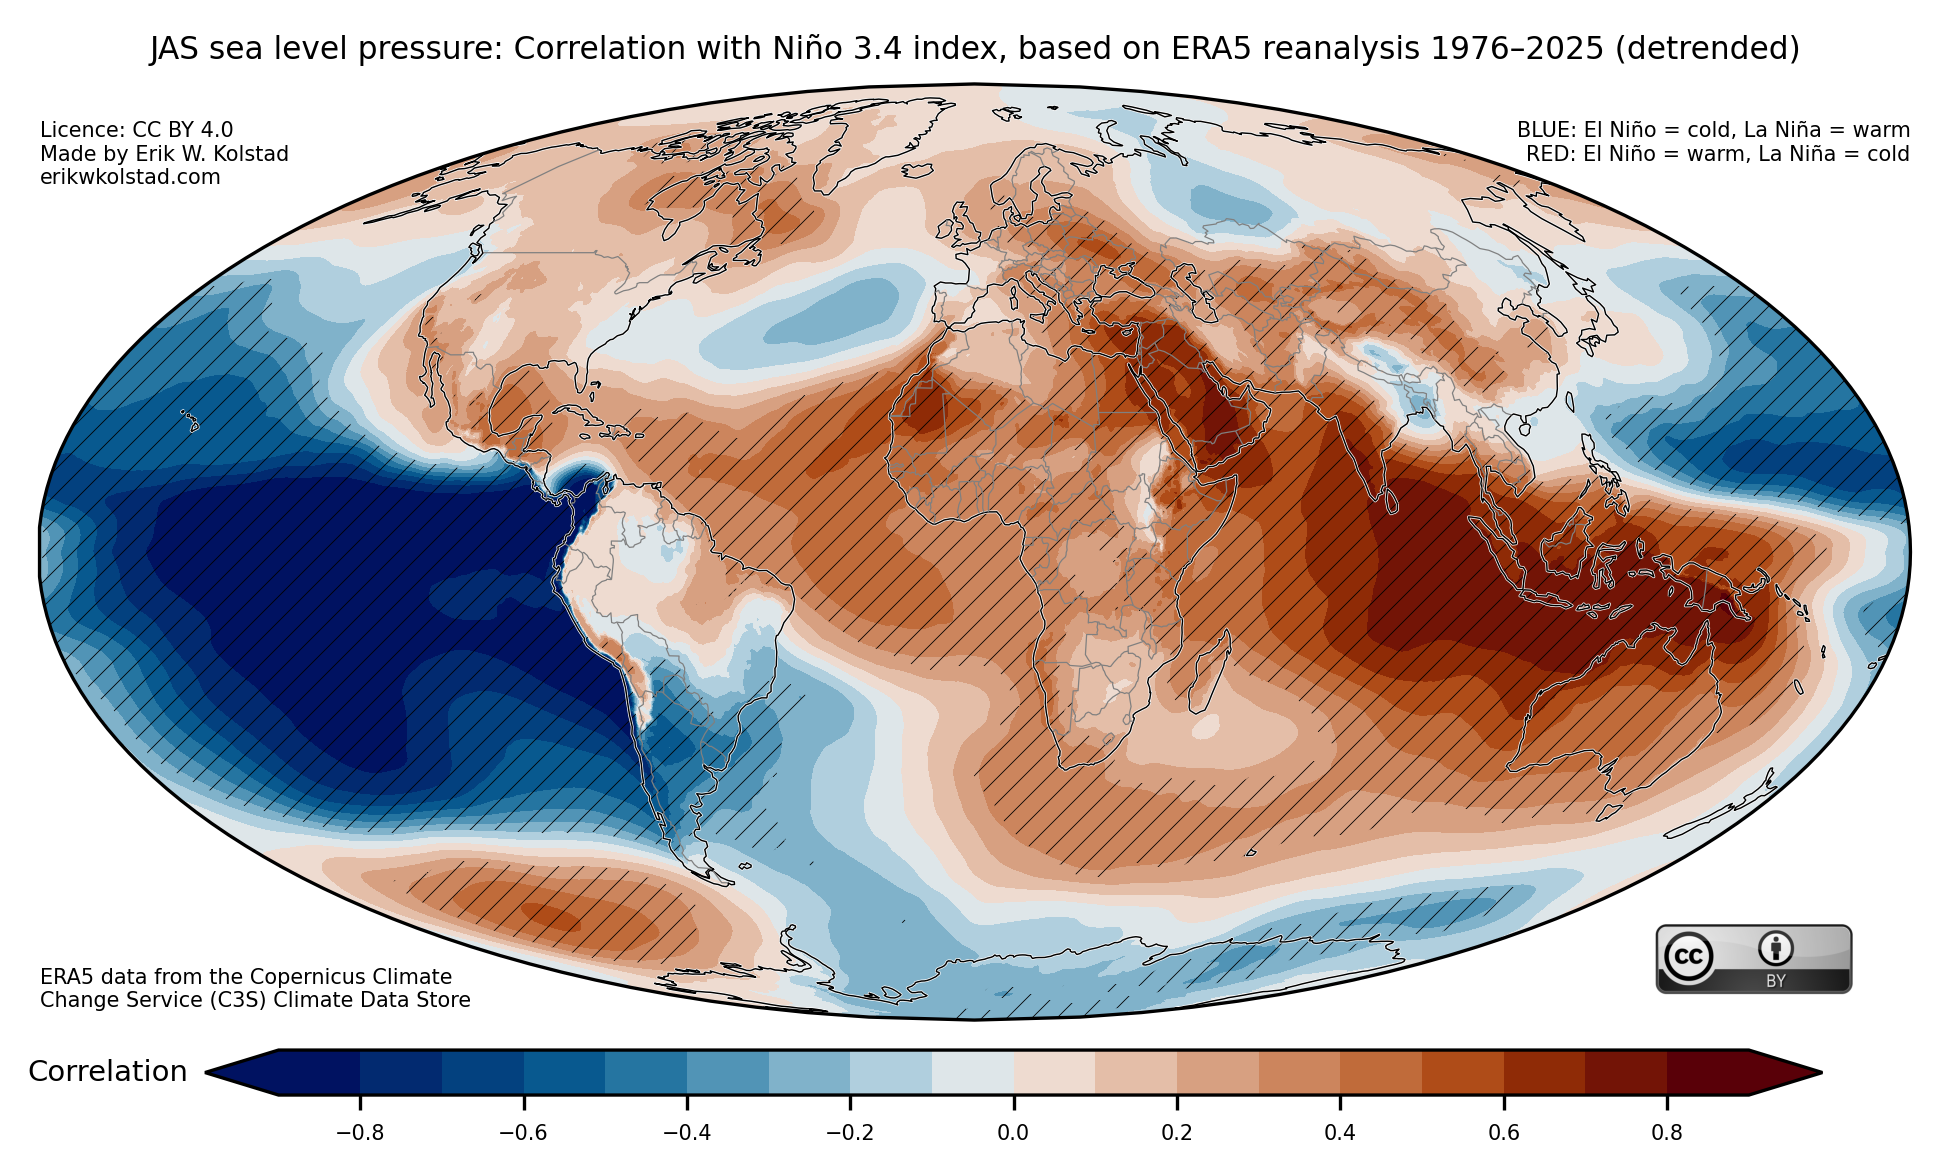
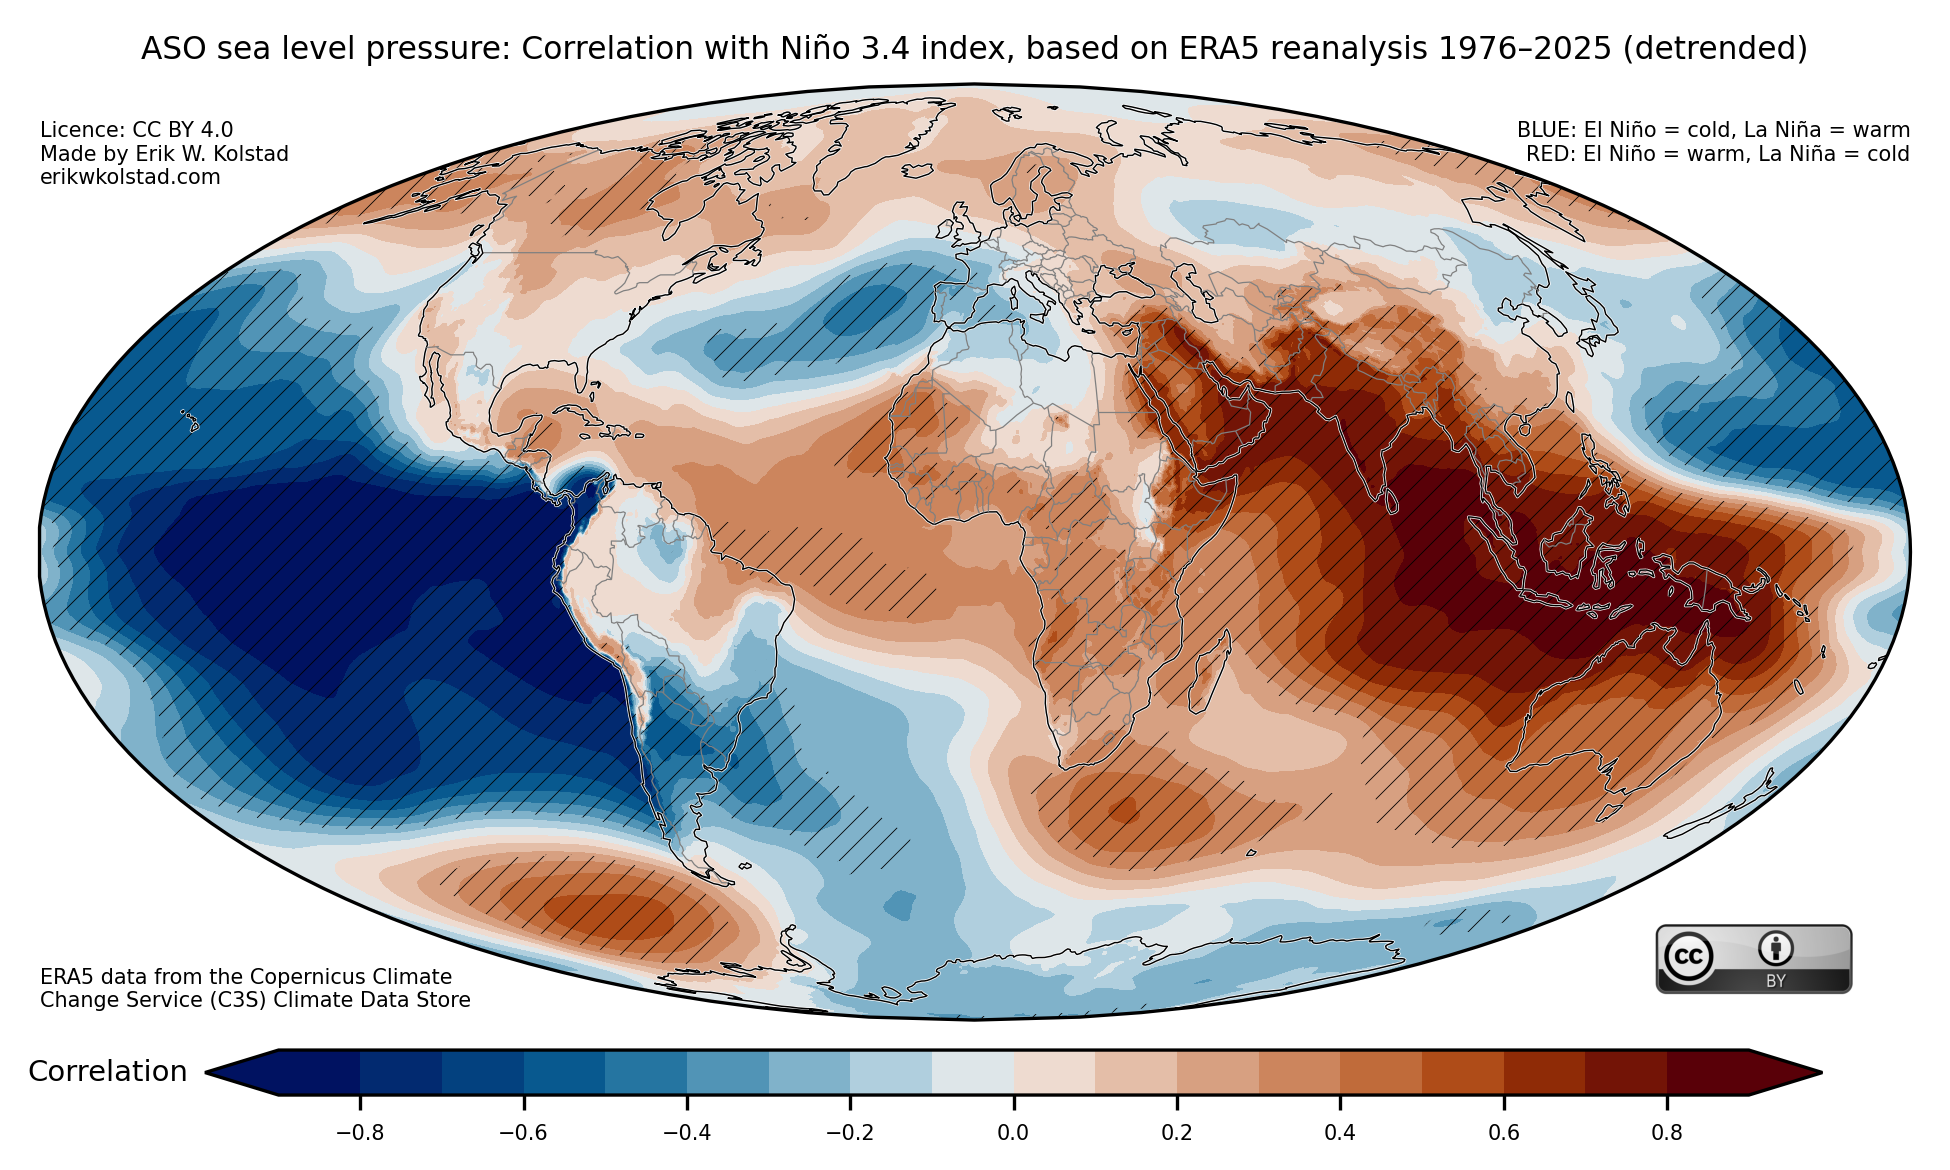
In the gallery below, I show the interannual correlation between seasonal (3-monthly) mean temperature and the Niño 3.4 index for all three-month periods. The first picture below shows the concurrent correlations for January–March, and the last one shows them for December–February. The hatching indicates where the correlations are significant. By clicking on one of the pictures, you can navigate back and forth between seasons.

The next gallery shows correlations for precipitation.

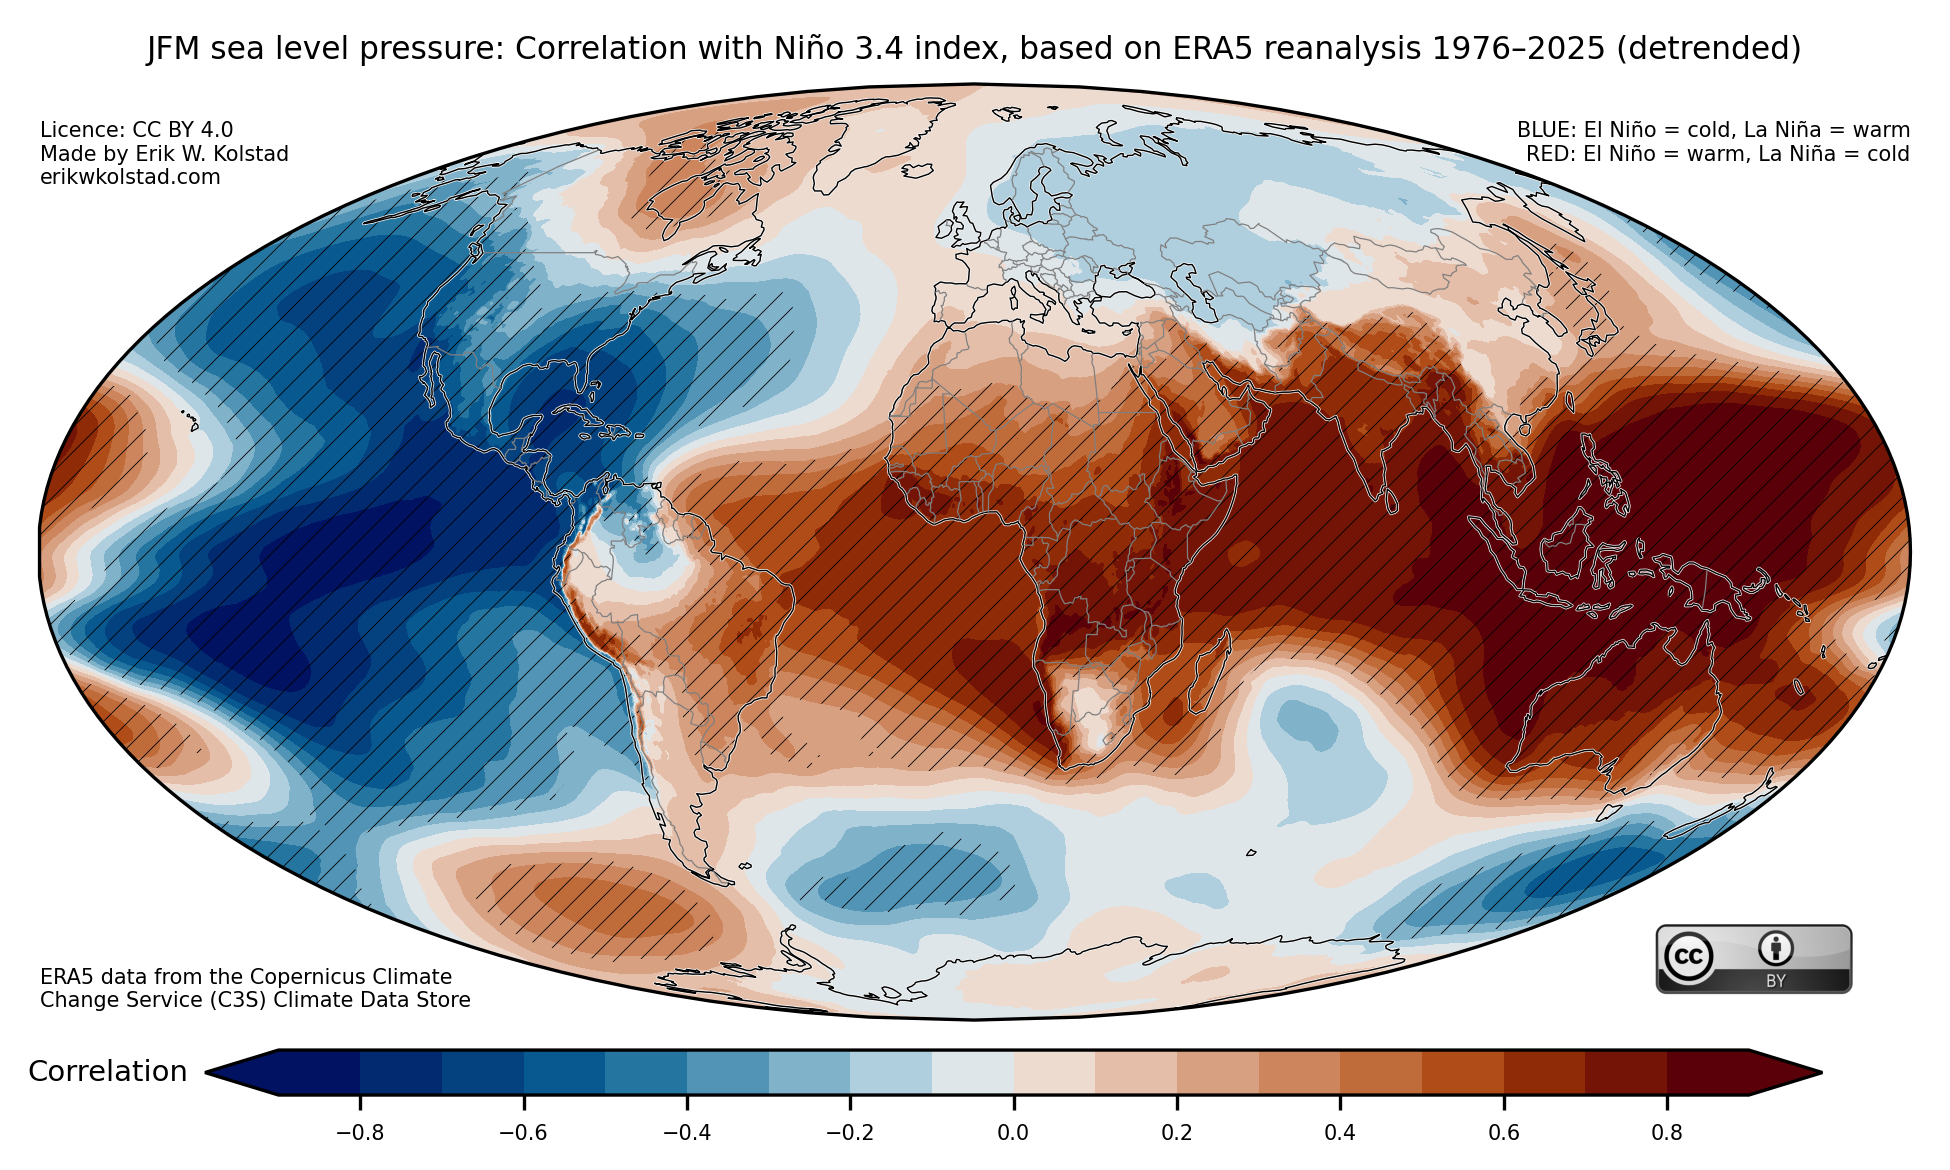
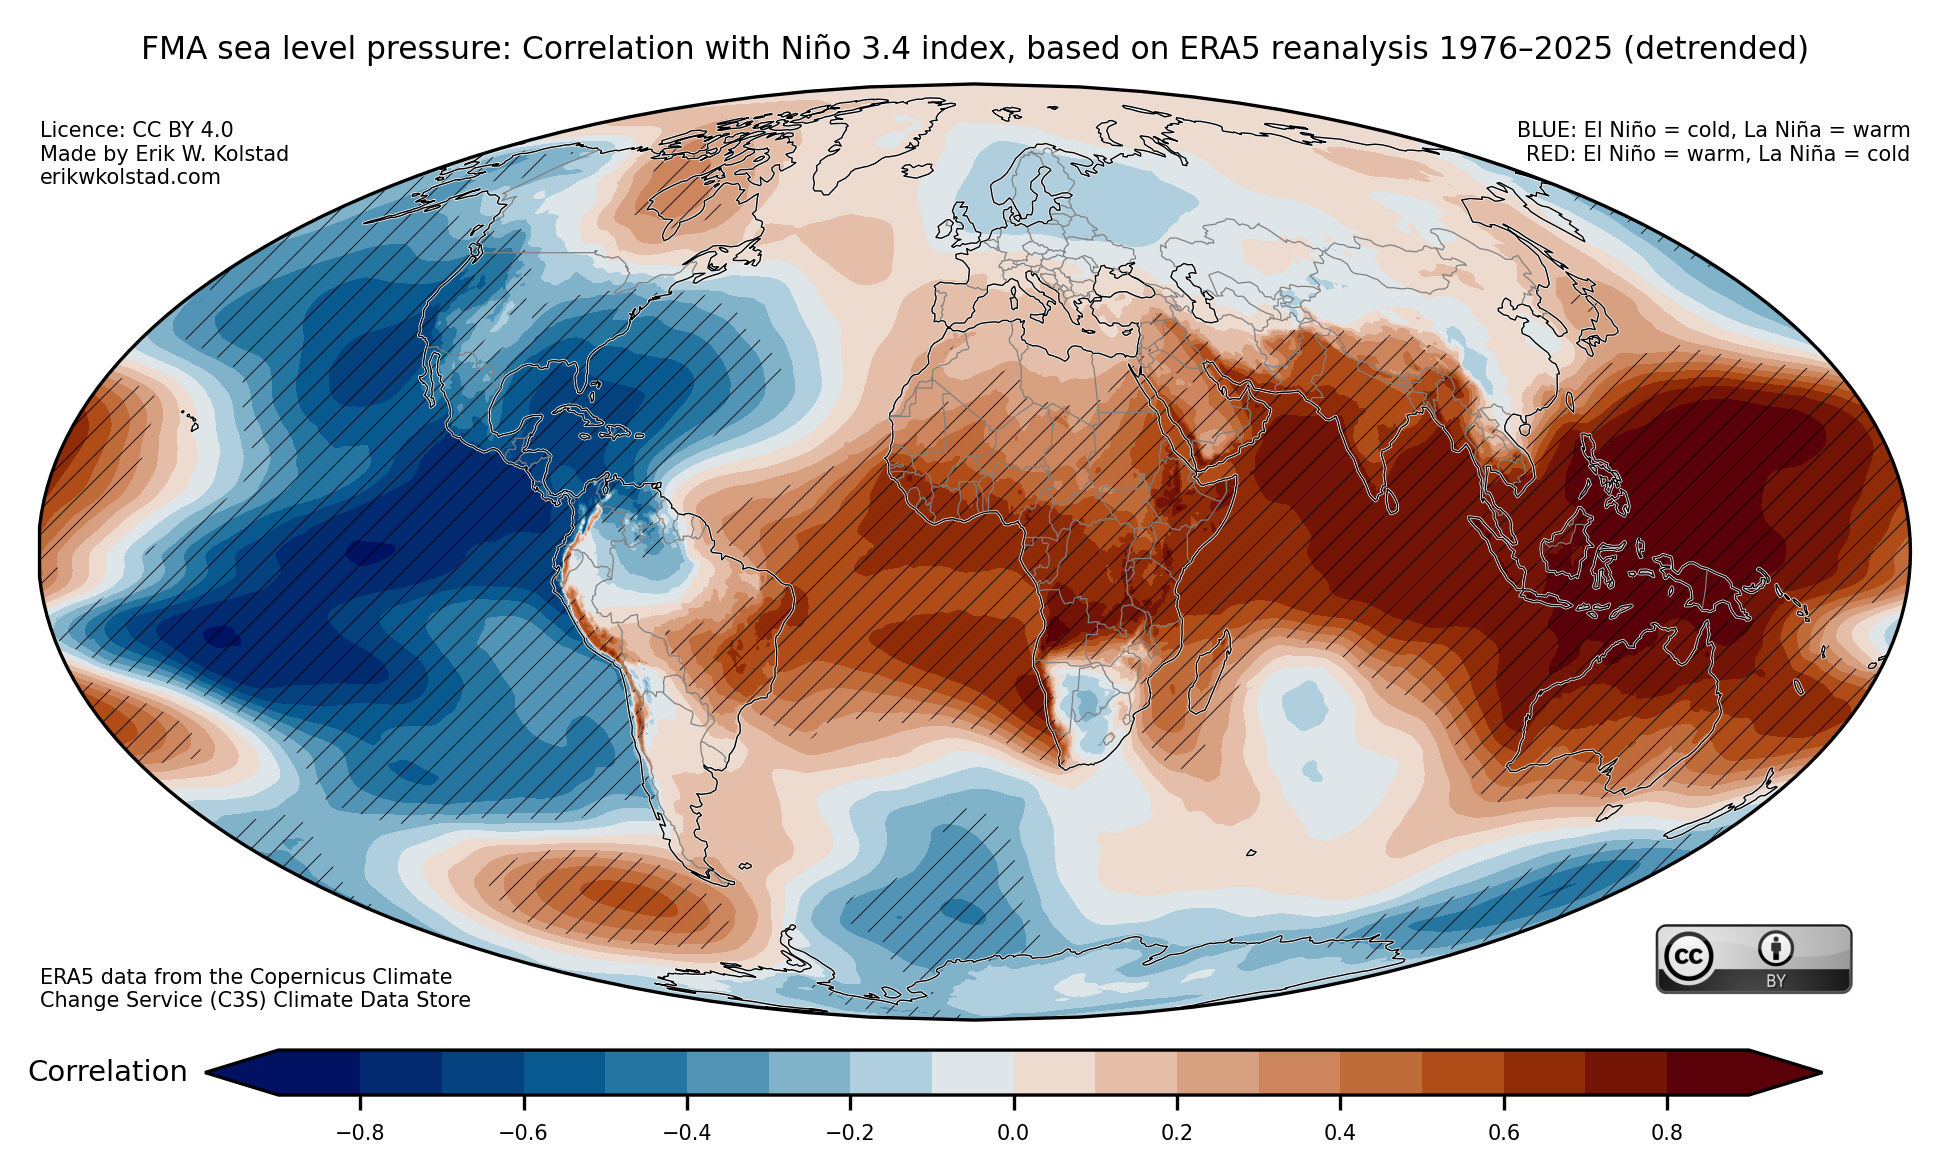
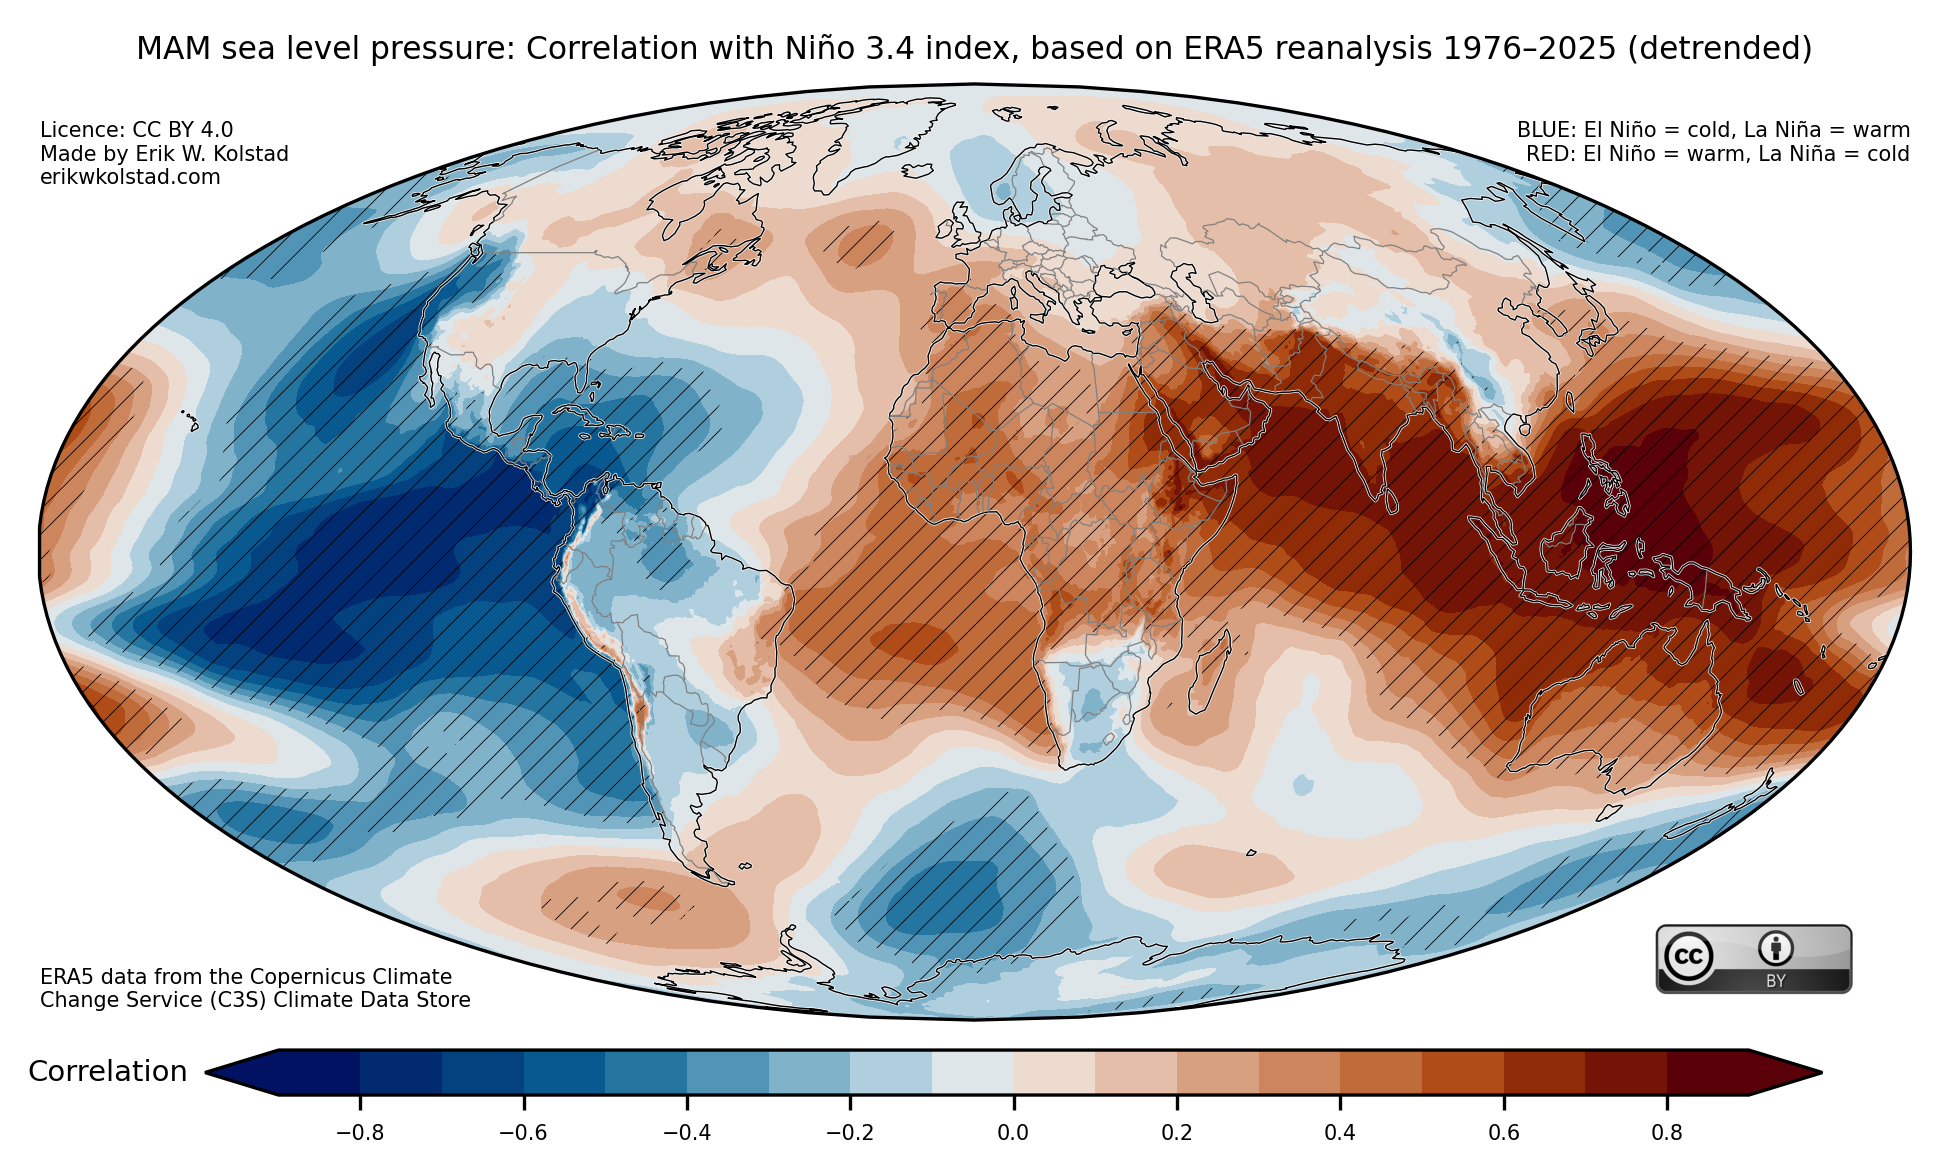
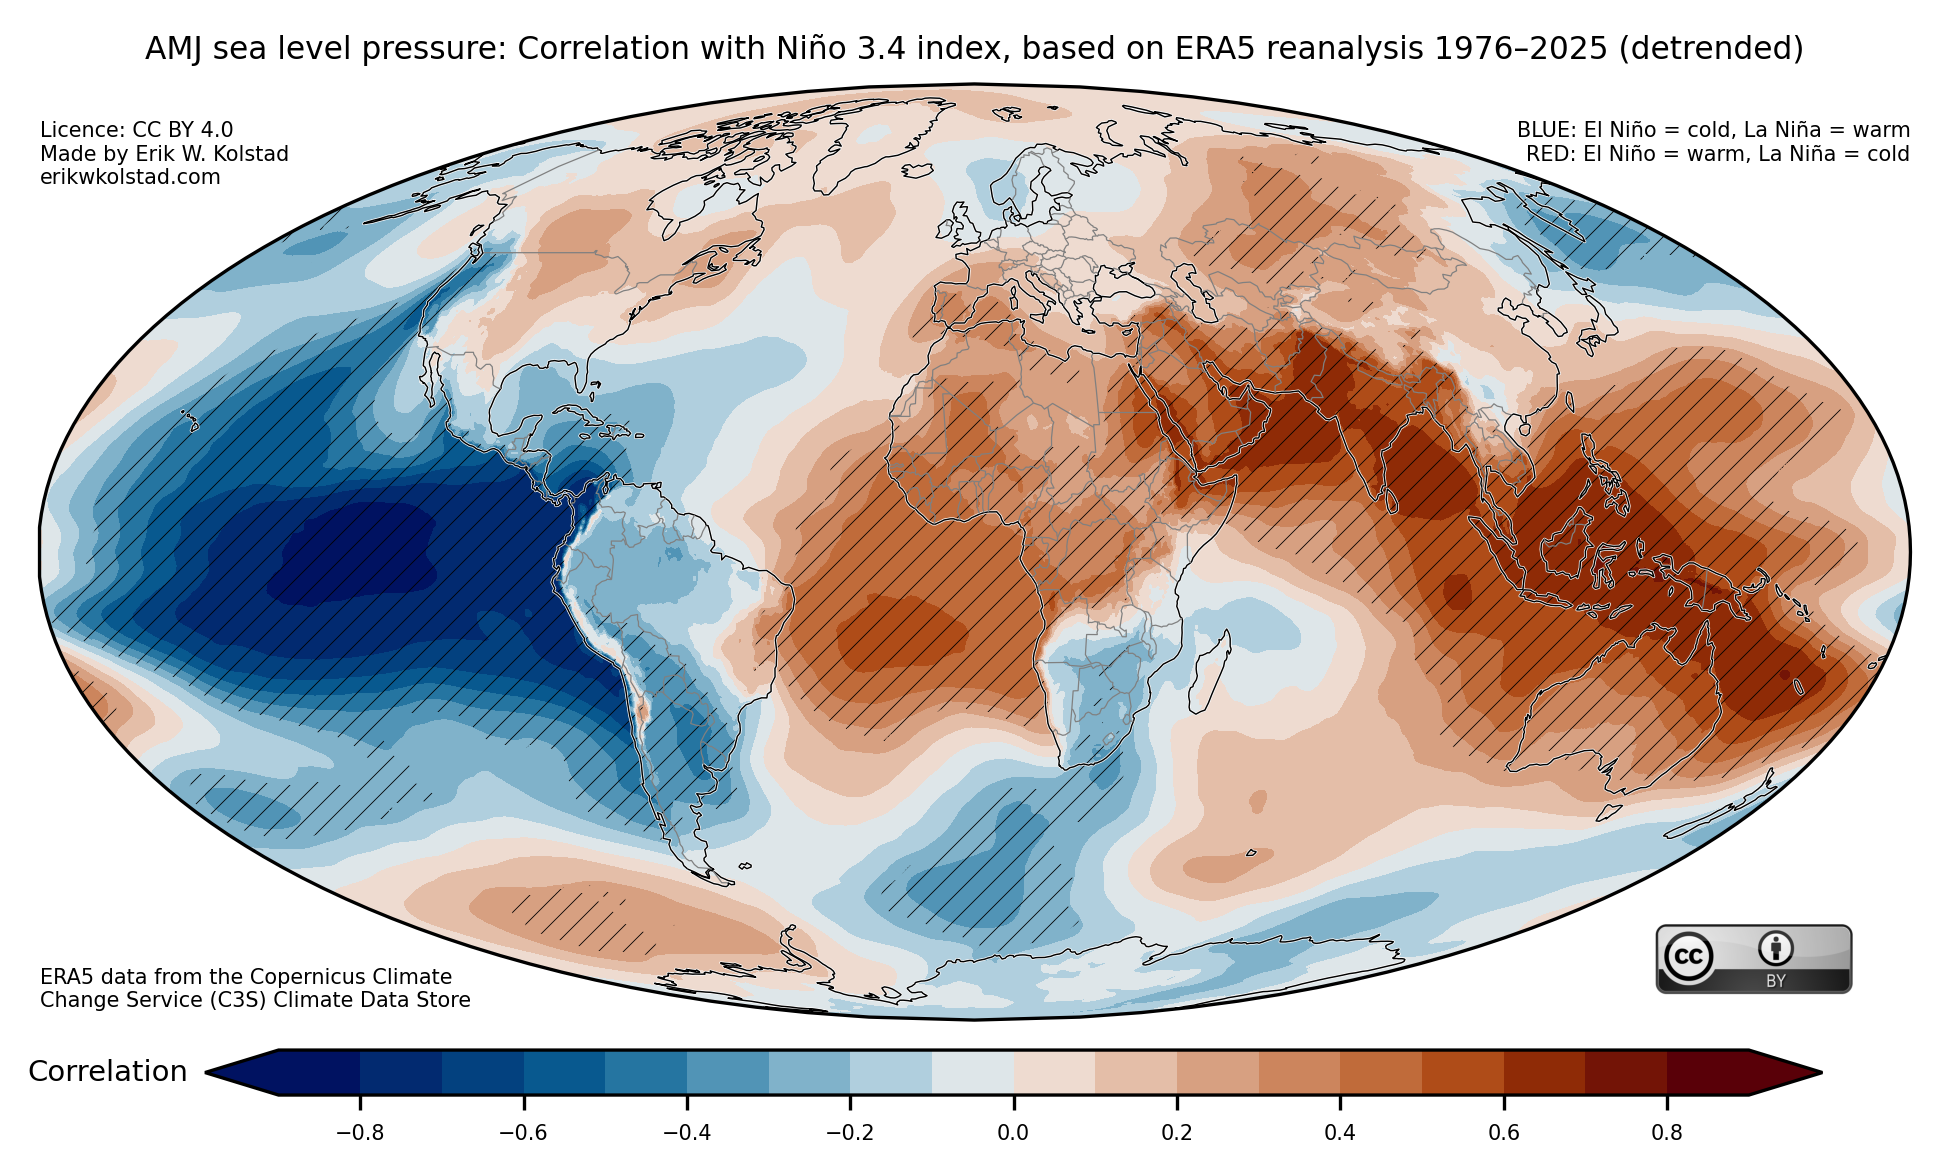
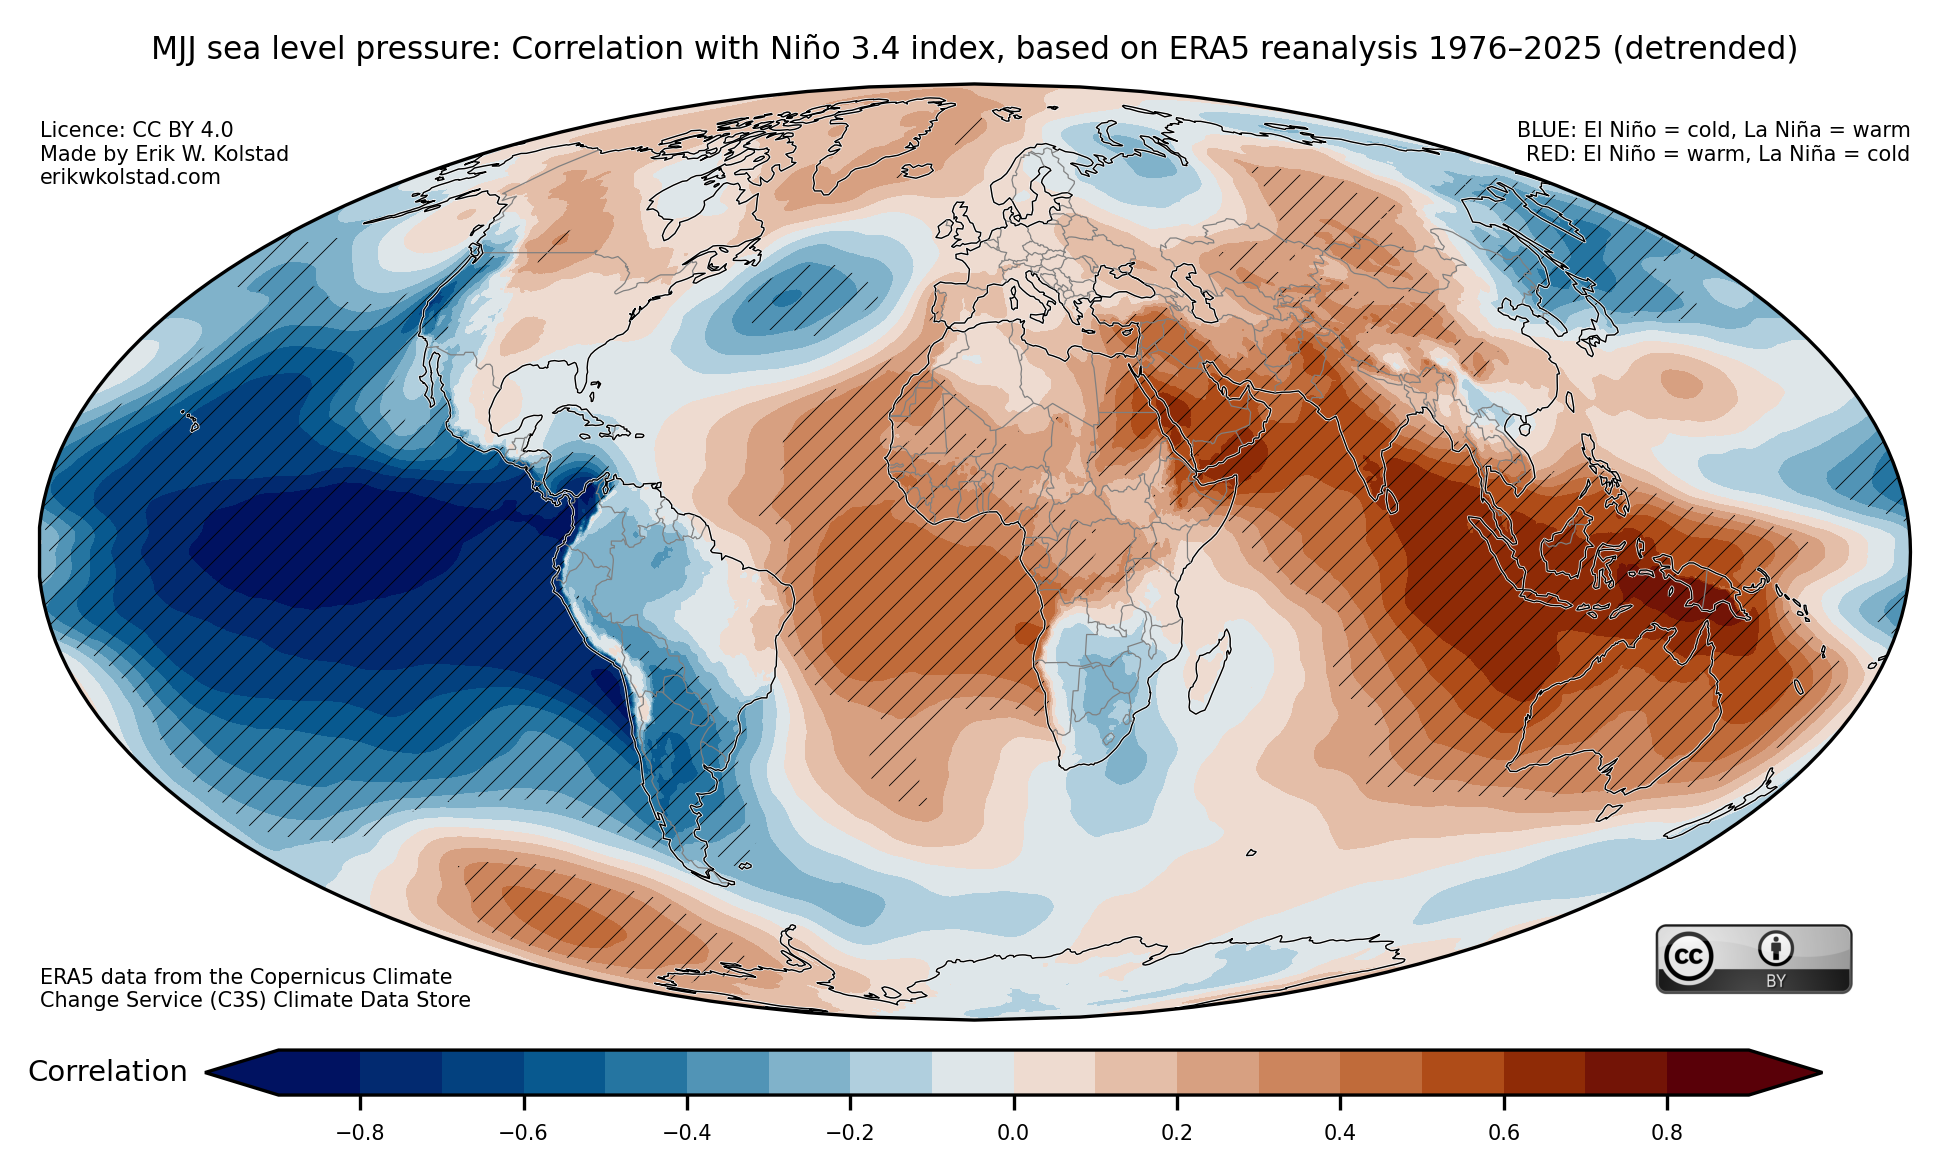
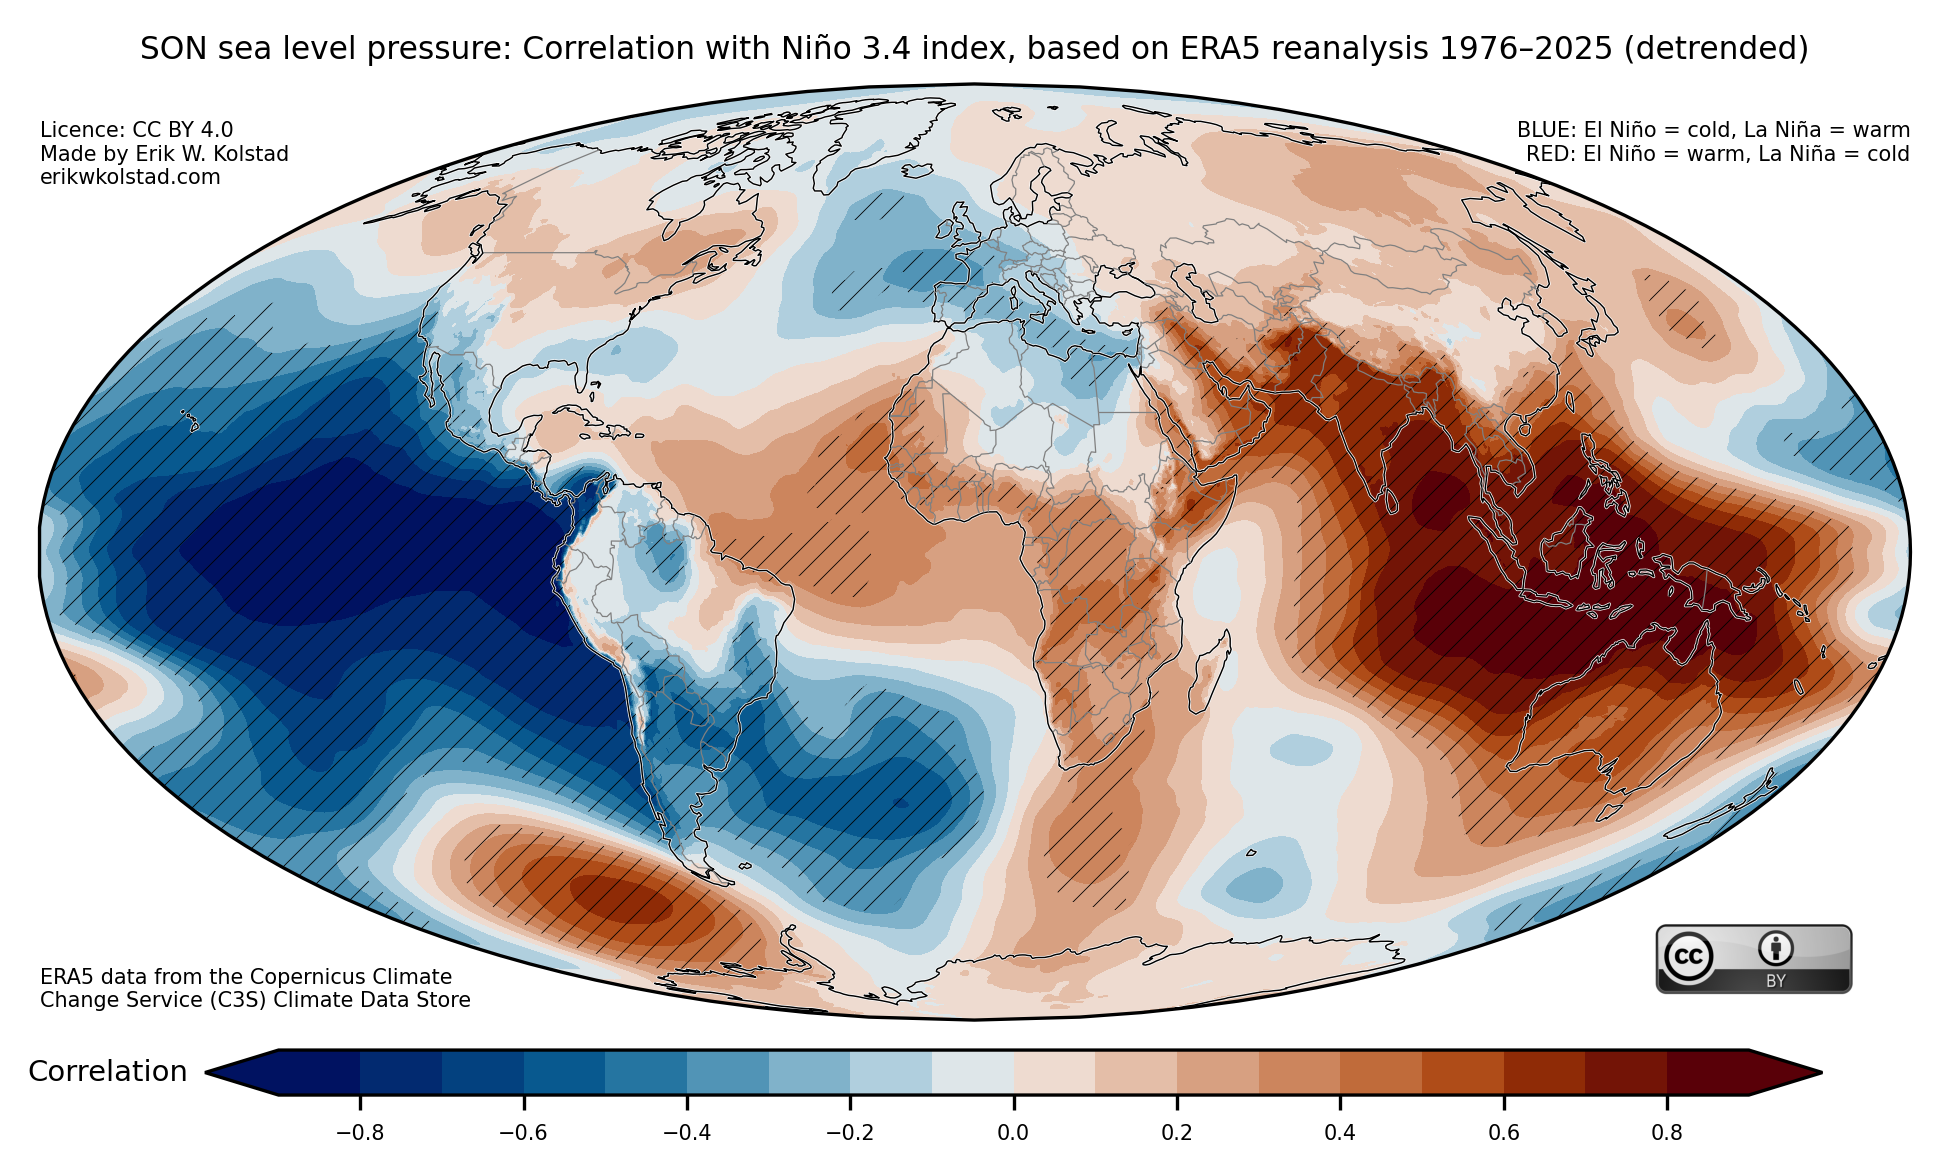
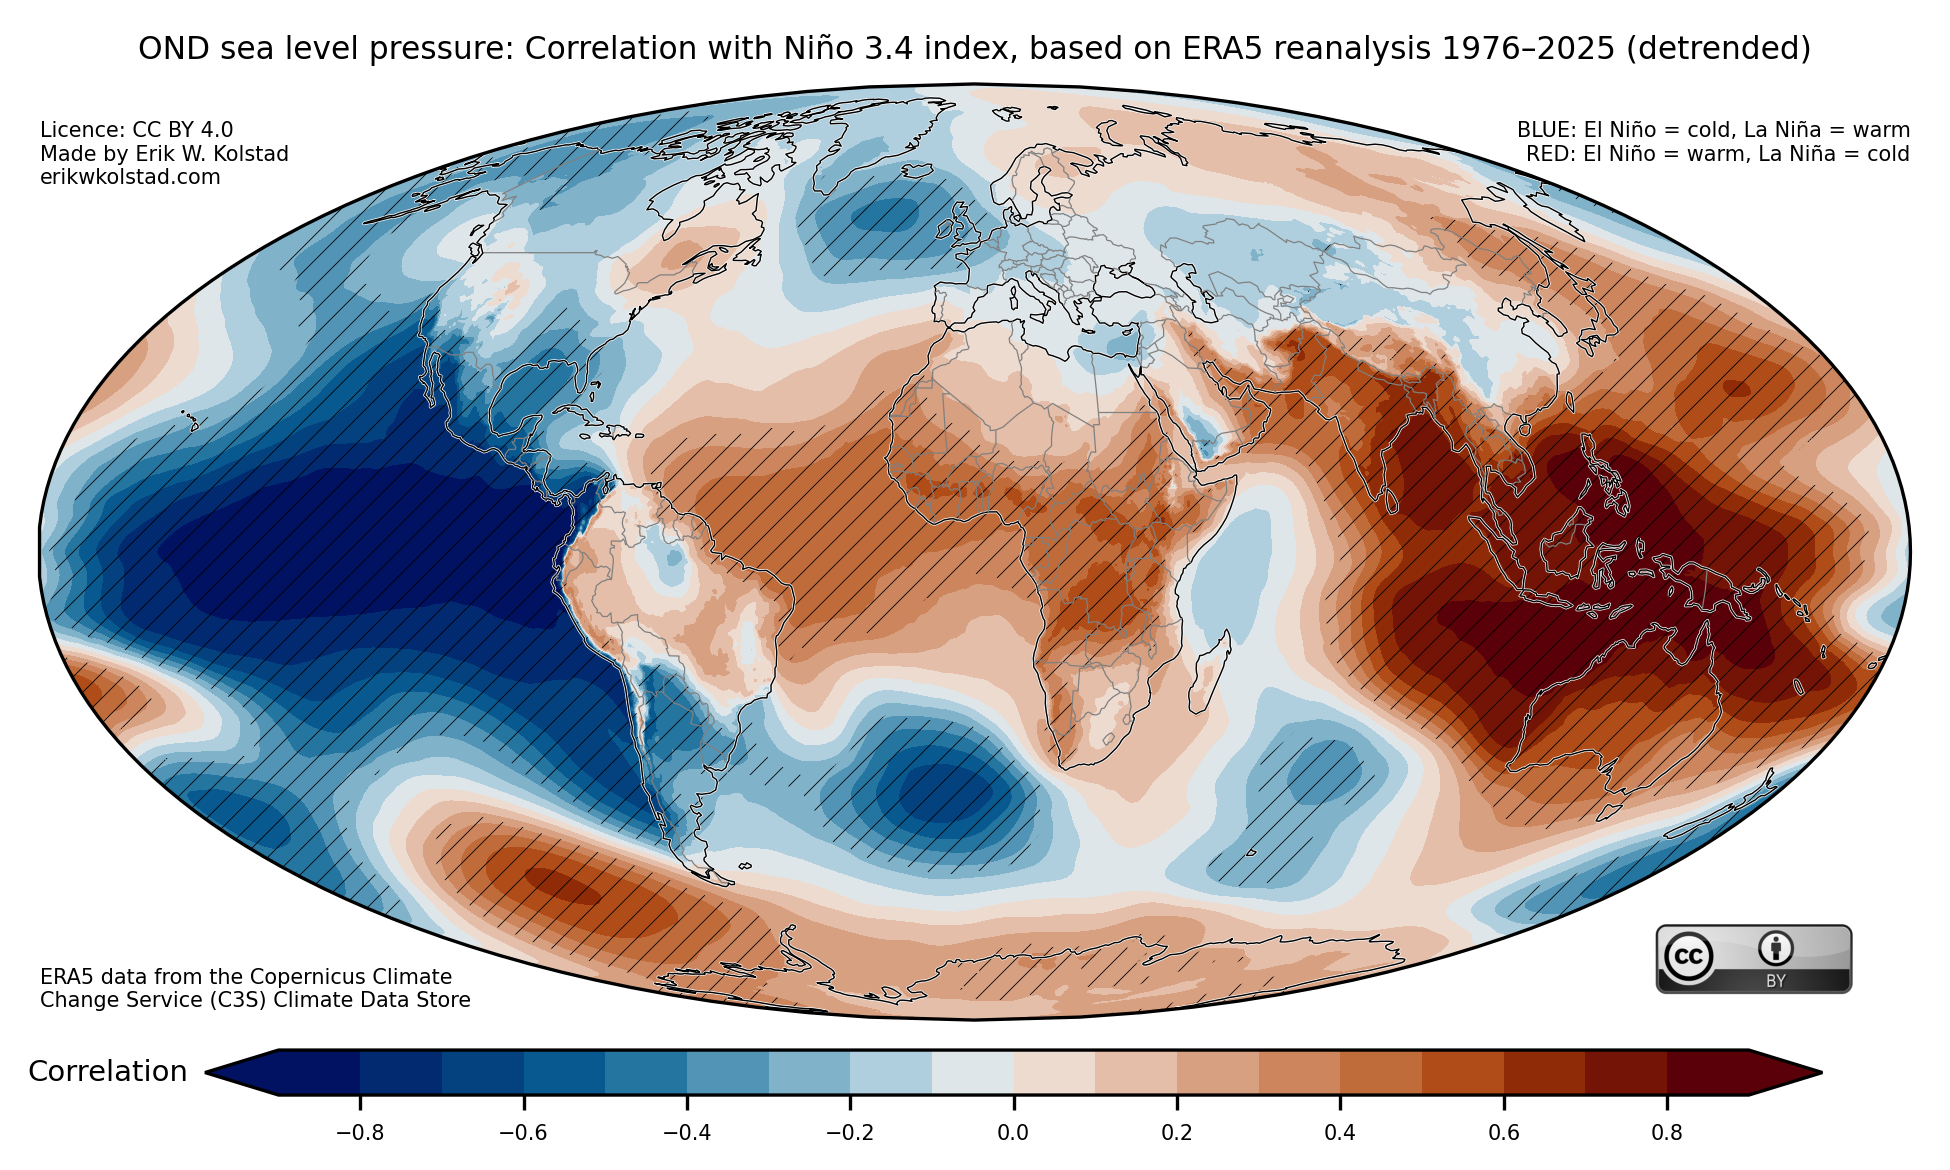
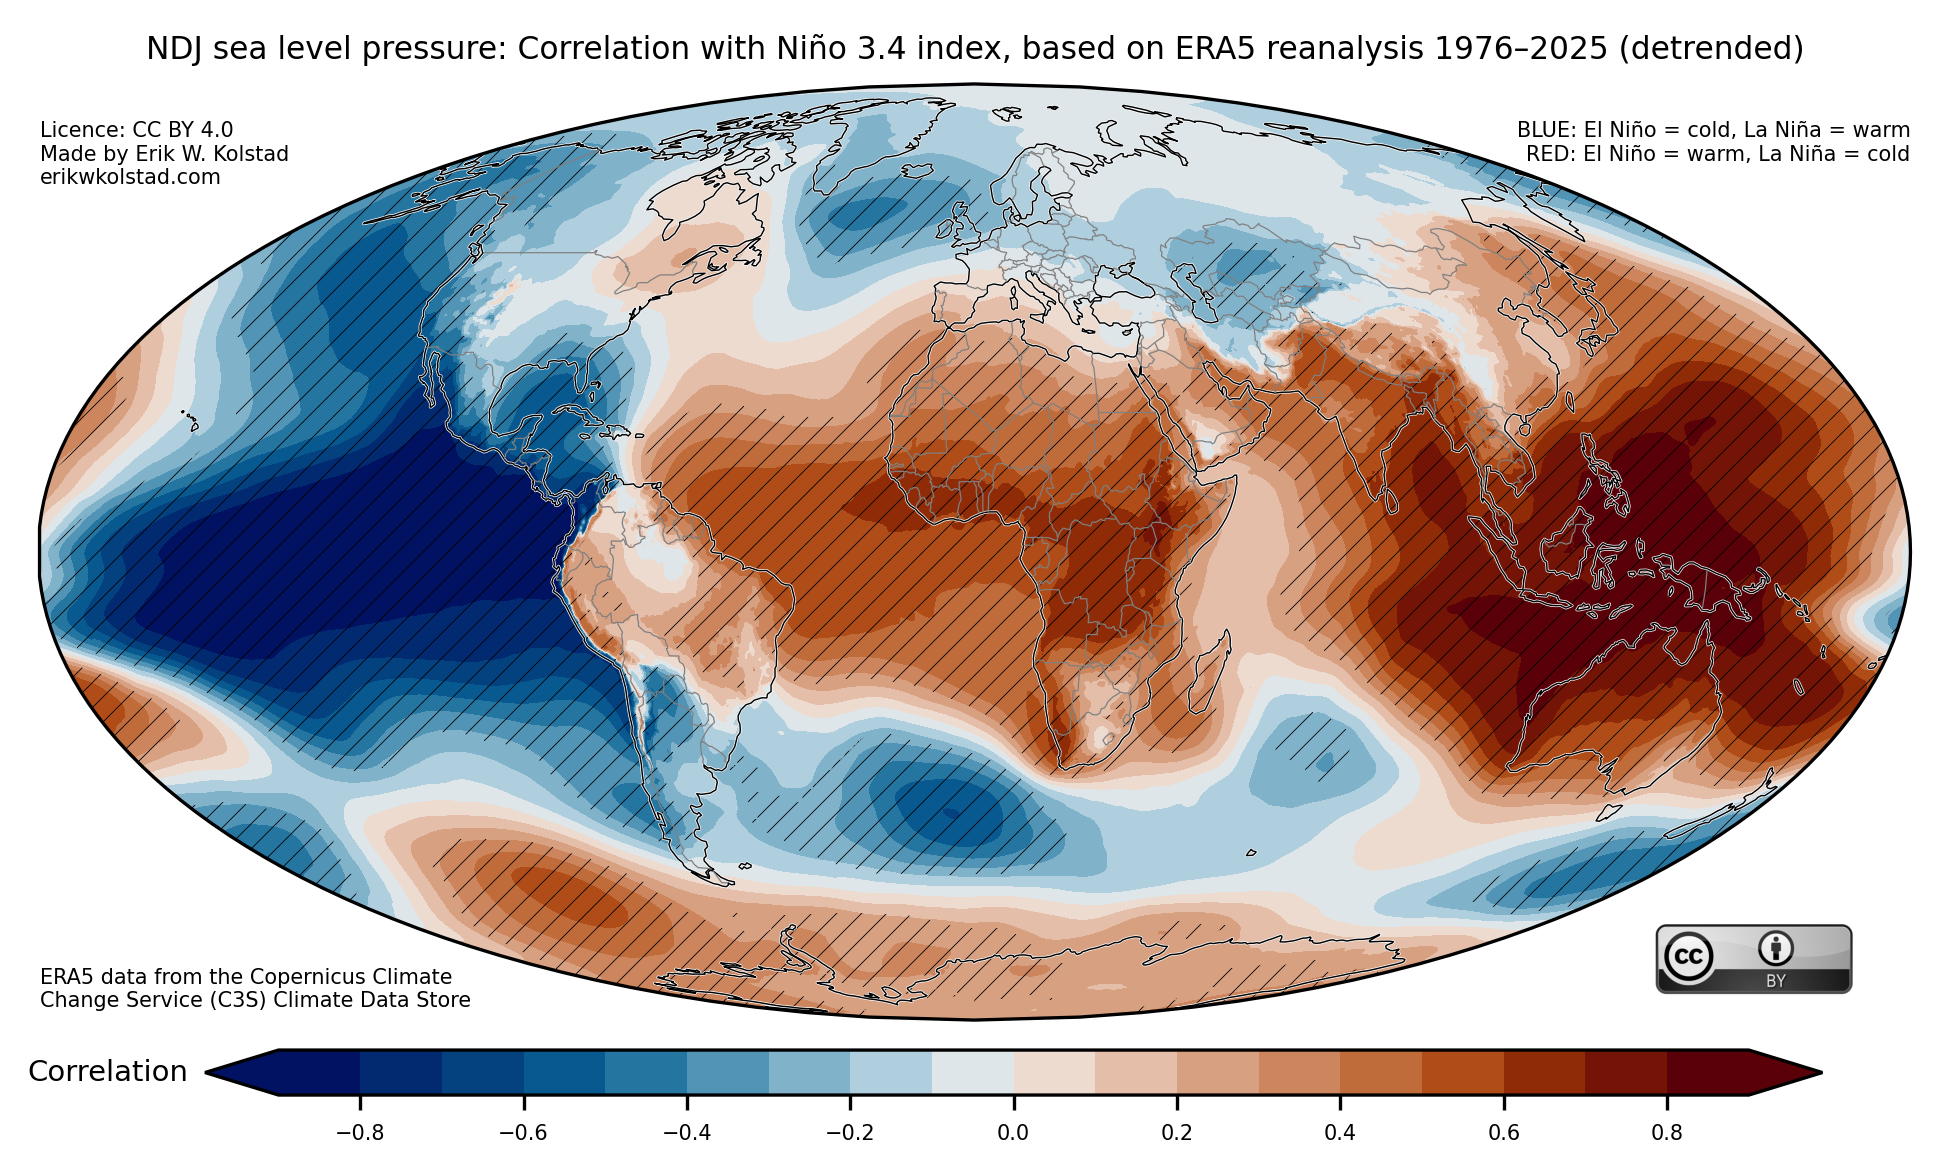
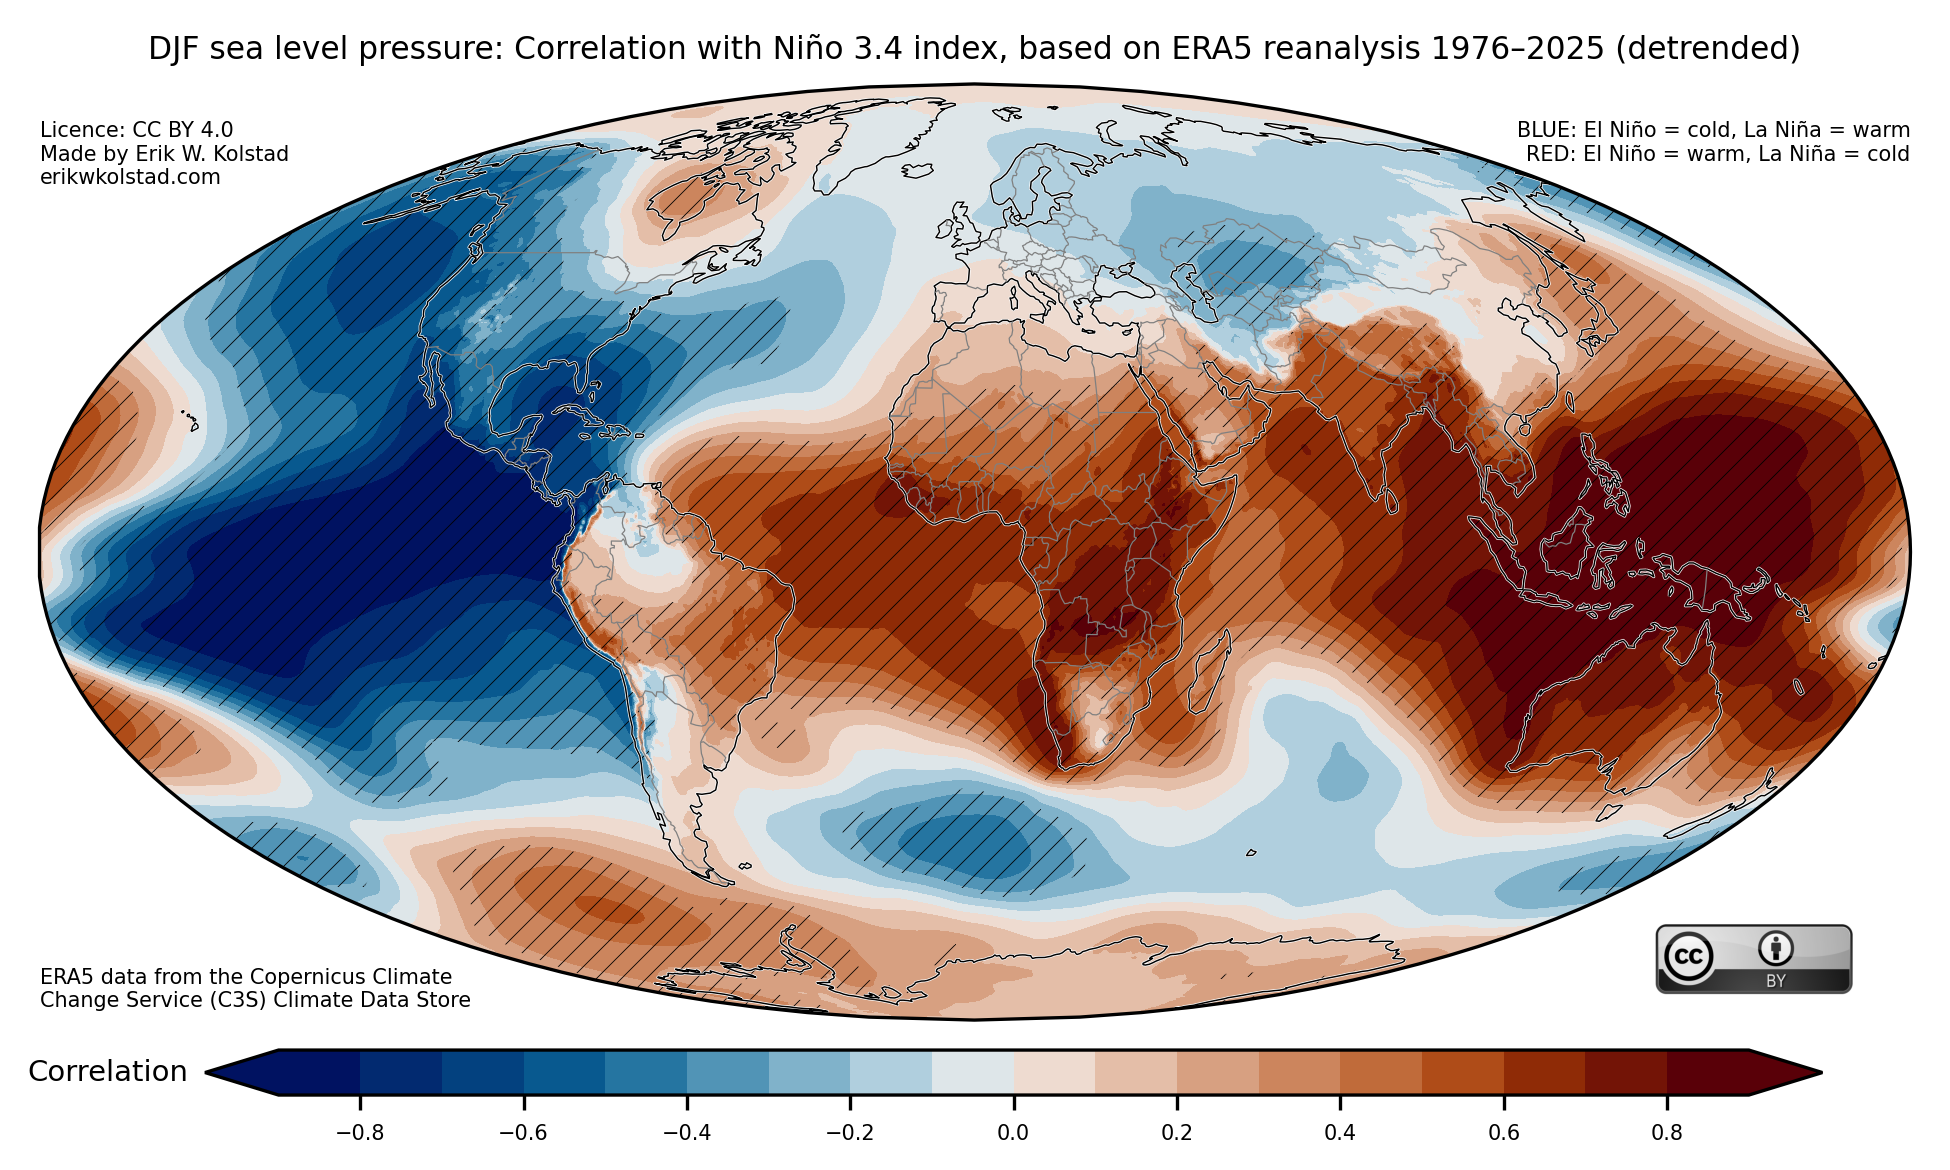
Finally, here are the maps for sea level pressure:

Hope this is useful! Please contact me if you have suggestions for improvements.

Methodology

I used monthly mean ERA5 data for sea surface temperature (SST), 2-metre temperature, (total) precipitation, and sea level pressure. All the data were downloaded for the period 1976–2026 (up to February only), and I linearly detrended all the data at the grid point level. The Niño 3.4 index was computed as the area-averaged SST anomaly between 170 and 120 deg. West, and from 5 deg. S to 5 deg. N. Statistical significance was estimated through bootstrapping, where the elements of the Niño 3.4 index time series were drawn randomly with replacement 100 times. Significance at the 5% level occurs when the actual correlation is outside the interval between the 2.5th and 97.5th percentiles of the boostrapped series.

The butterfly effect illustrated

I had some fun with Google Gemini today. I wanted to illustrate how weather forecasts become uncertain after a few days due to the butterfly effect. This occurs because we can never be completely sure of what we call the initial conditions: the state of the weather, ocean, sea ice, etc. at the time when we create the forecast. By varying these initial conditions slightly and running the forecast multiple times, they will start out more or less identical but then diverge after a few days.

I wanted to illustrate this with an analogy. It is impossible to accurately predict how water will flow down a stream because there are multiple obstacles along the way. For instance, if there is a rock somewhere, we can’t know if the water will flow to the left or right of the obstacle. I instructed Gemini to illustrate this, and here’s what it came up with:
Pretty awesome if you ask me. The next step was to illustrate how this could look for an ensemble of temperature forecasts for a given location. I asked Gemini to emphasize how the individual ensemble members gradually diverge. Here’s the result (after some back and forth):
That’s it. Now I’m ready to explain this concept to the students at our upcoming CATER school in Madagascar next week.
Boreal Summer Predictions for 2024

In Climate Futures, we’ve tried something new this year. Rather than comparing the seasonal predictions for the boreal summer to a normal period – which seems to be a very abstract concept to most people – we’ve compared it to the last nine years. When we include 2024, this gives us a nice 10-year period as a reference. The great thing about this period is that (most) people are able to remember some of the years in it; for instance, the hottest summer.

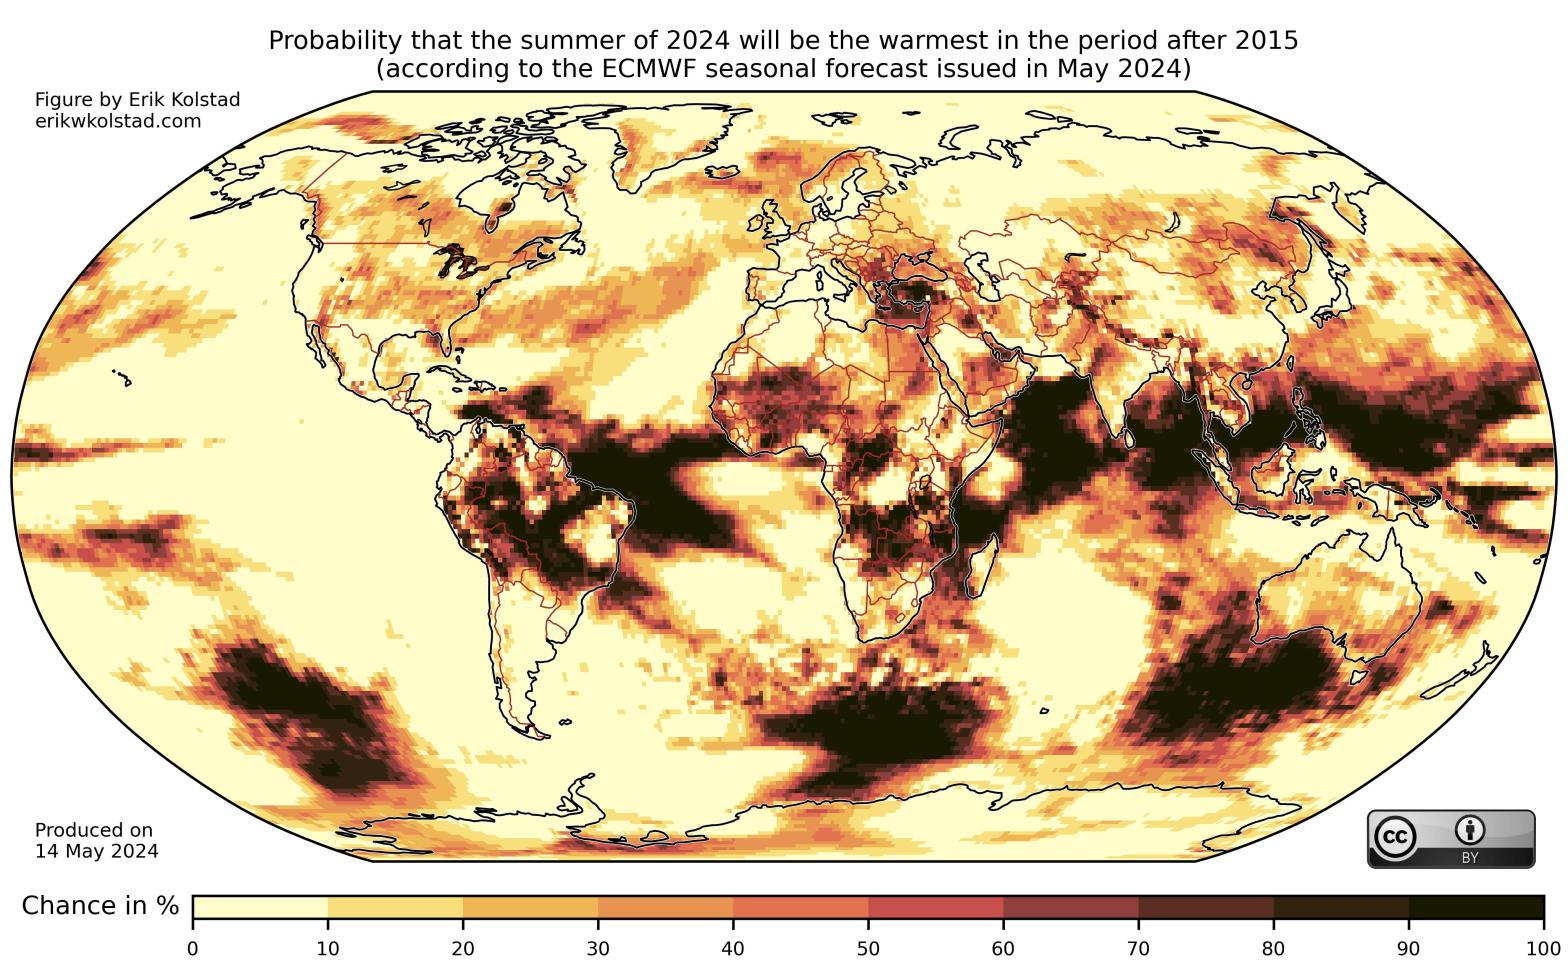
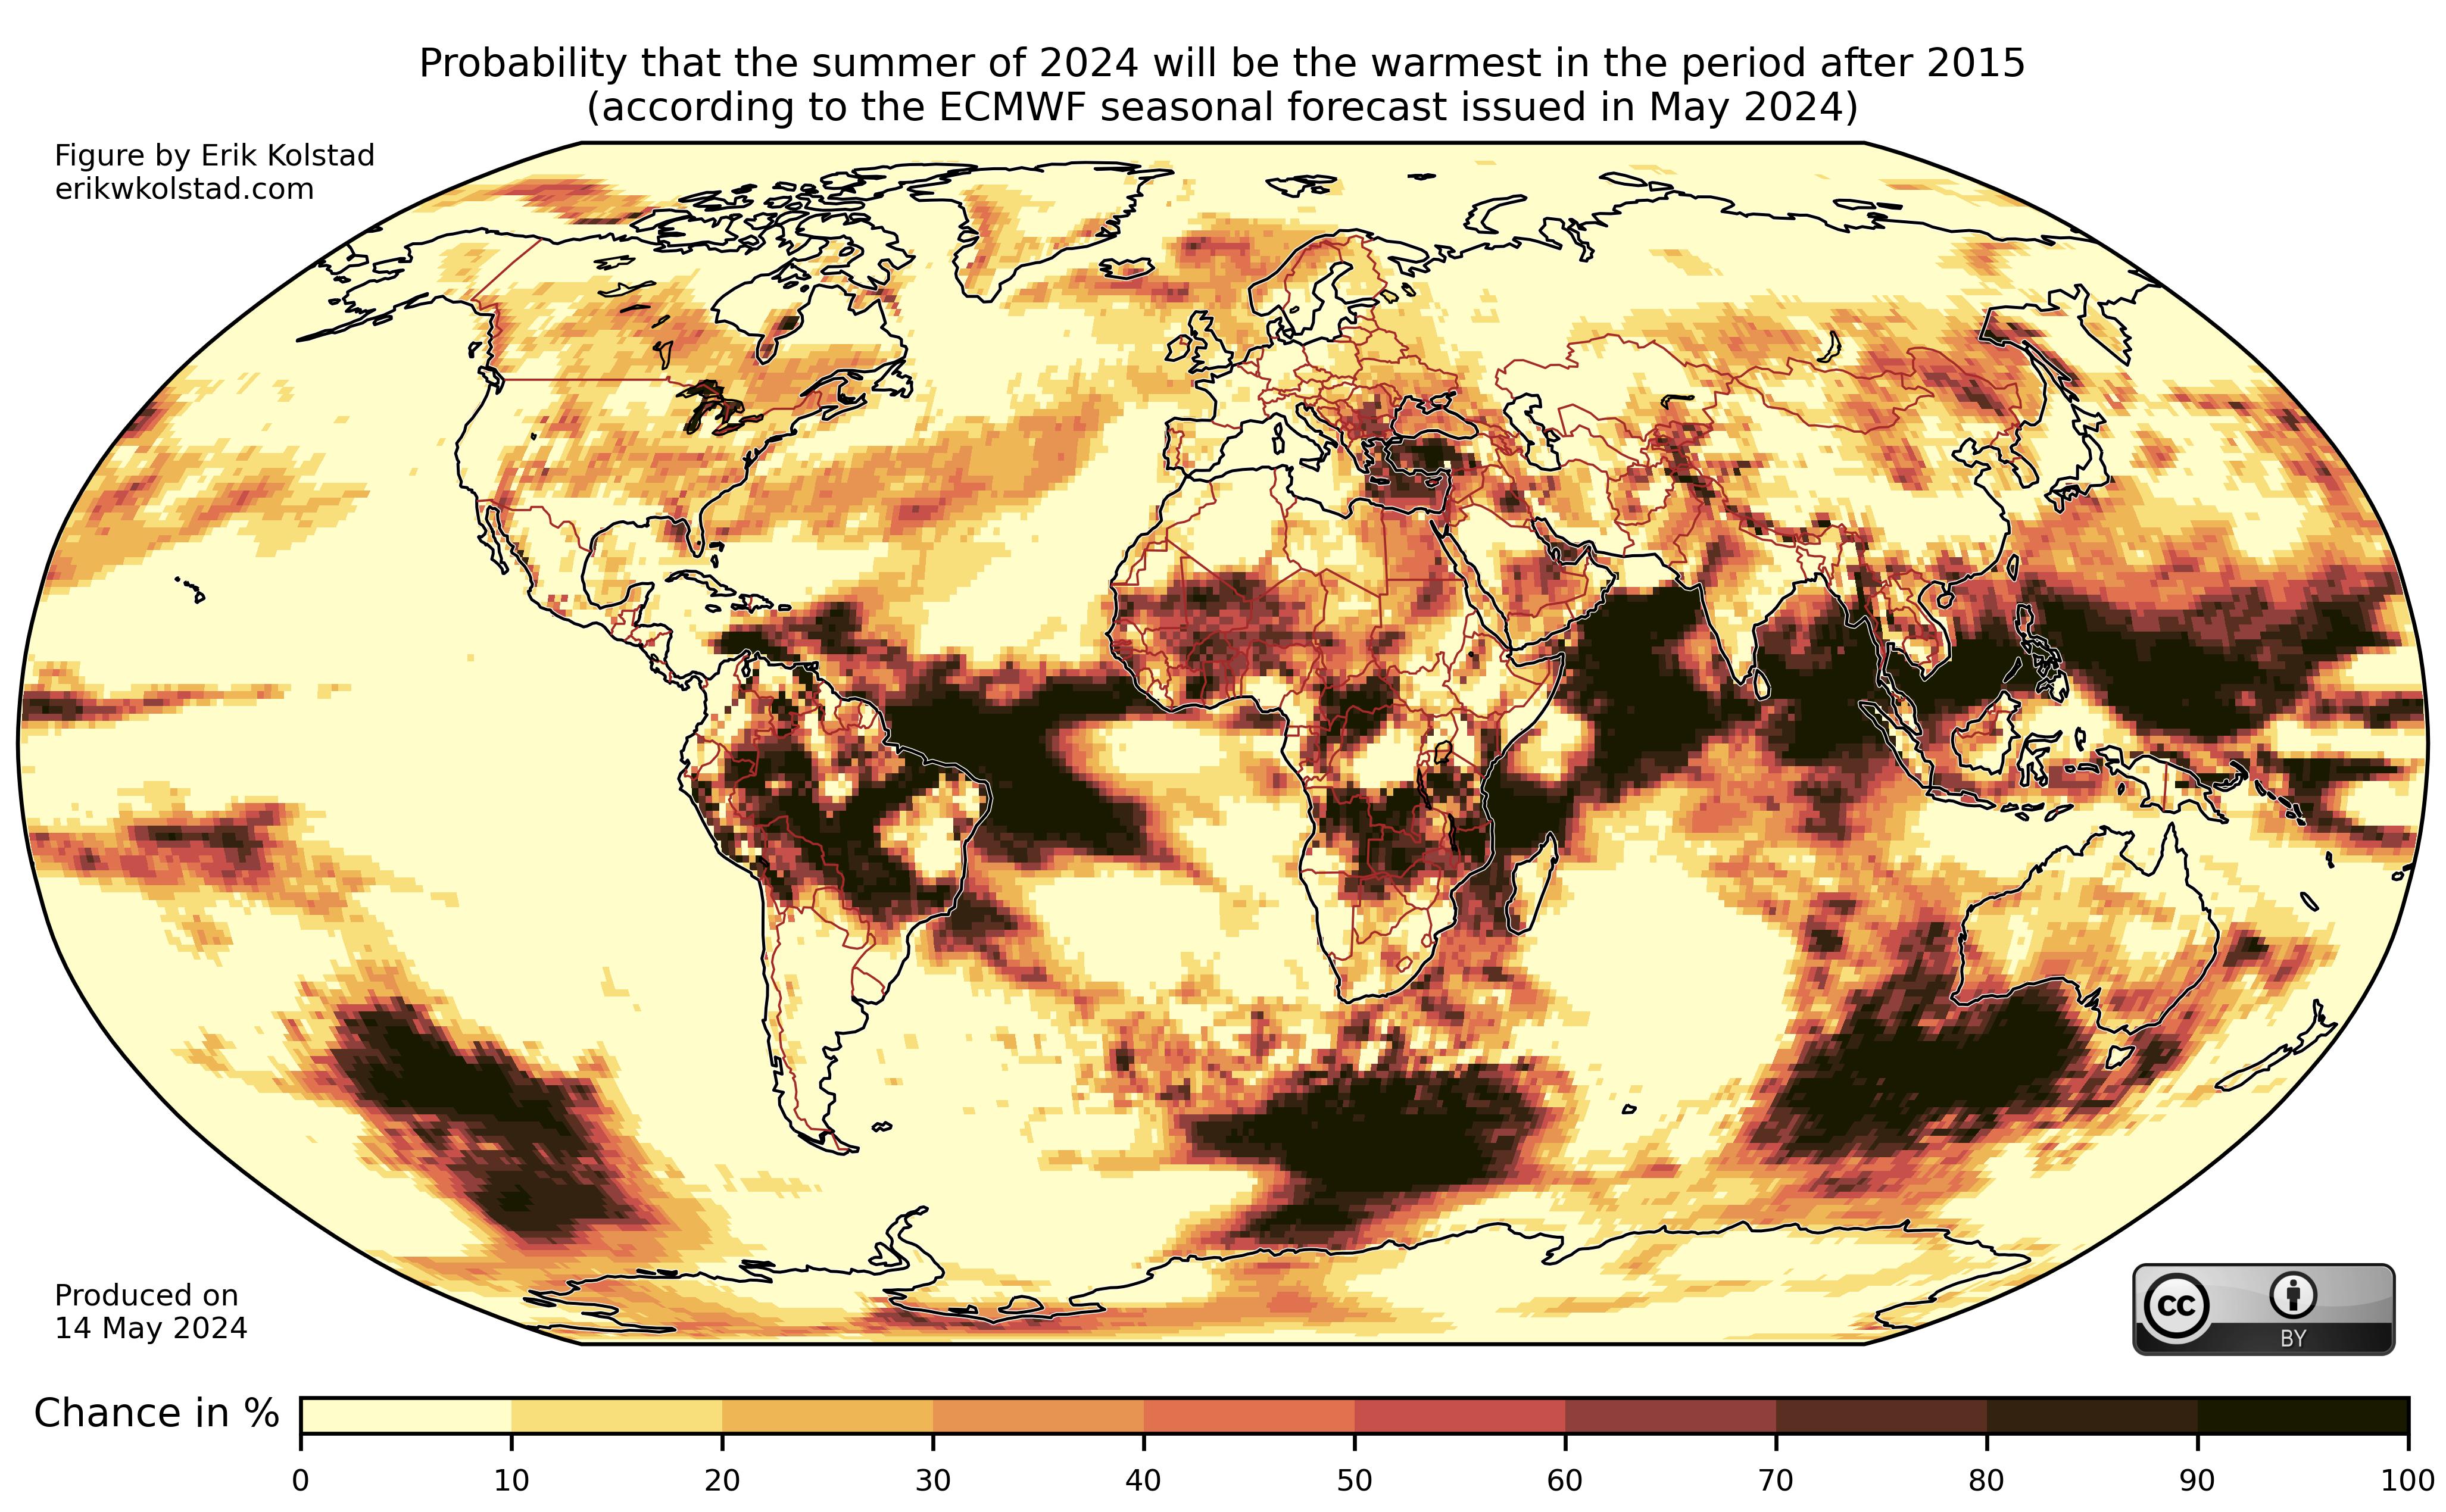
In the figure below, we’ve estimated the likelihood (according to one prediction model) that June–August 2024 will be the warmest such period over the last 10 years. In most locations worldwide, the chance is about 10%, which is the default statistical probability (one in 10 years = 10%). However, in other regions, like the eastern part of the Mediterranean, West Africa, and large parts of Brazil, the likelihood is substantially higher.

Likelihood (in percent) that the average temperature during the 2024 summer (June–August) is higher than the highest average summer temperature in 2015–2023. The calculations are based on the 51 ensemble members of the May forecast produced by the ECMWF.

Comparing the likelihood of any event to just one previous observation is risky in the world of statistics. It is more robust to use a percentile as the reference. The figure below shows the estimated likelihood that June–August 2024 will be among the top three warmest boreal summers in the period starting with 2015.

Likelihood (in percent) that the average temperature during the 2024 summer (June–August) is higher than the third highest average summer temperature in 2015–2023. The calculations are based on the 51 ensemble members of the May forecast produced by the ECMWF.

The default probability is 30%, but according to the forecast model it is much more likely than that in many areas. The regions that were mentioned when discussing the previous figure are still in the high probability range, but other areas, like Mexico and Norway, are now deeply in red terrain.

I conclude by reminding everybody that the uncertainty associated with June–August forecasts produced as early as May is high. Here’s a validation figure for the ECMWF model:

Verification figure for the ECMWF model for May predictions of June–August. Details of what is shown can be found here.

Details can be found here, but the short story is that forecast skill is low in the stippled areas, which include most of Europe.

Annual cycle of East African rainfall

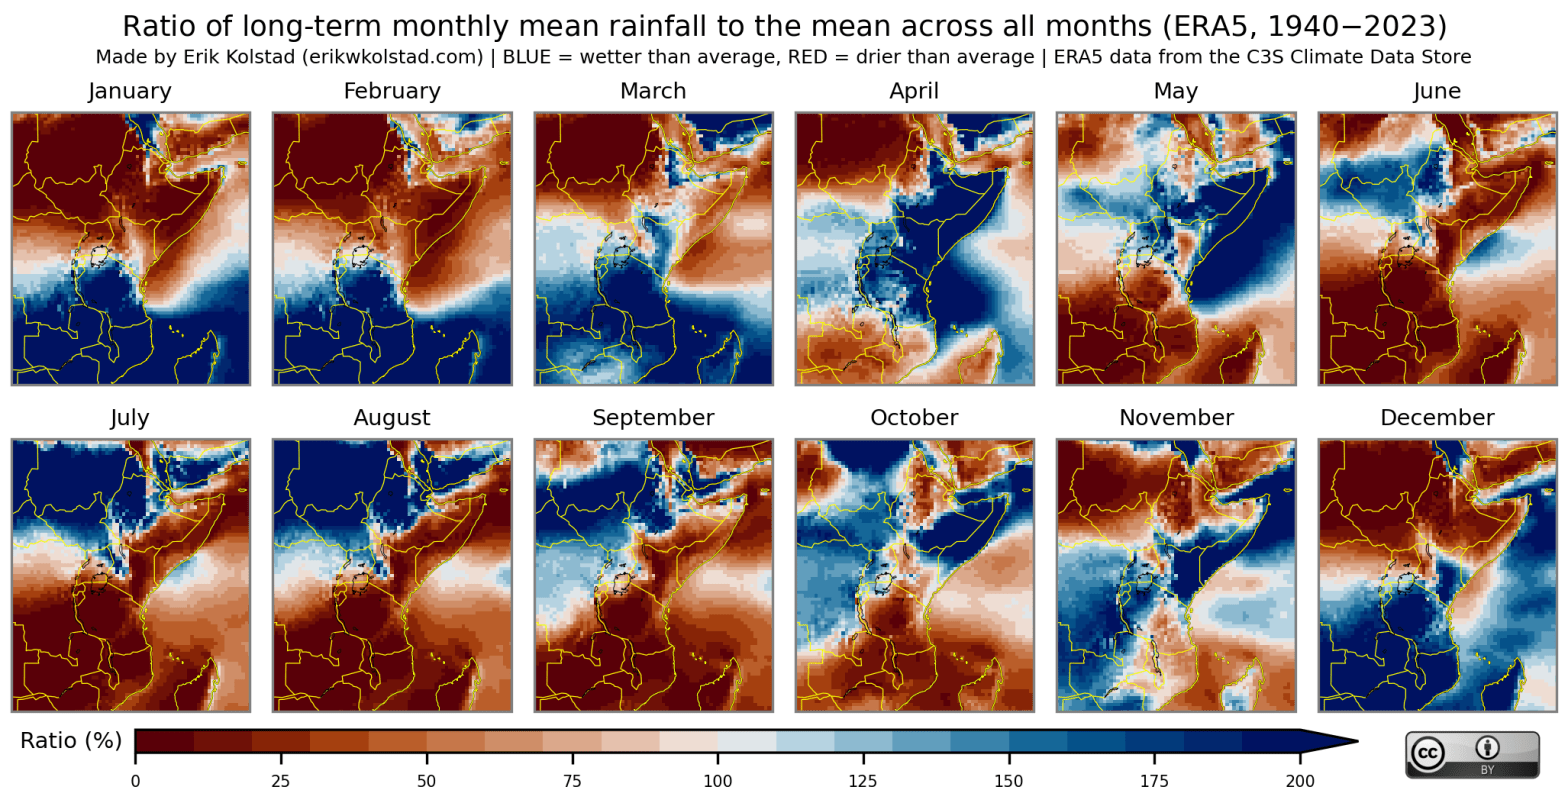
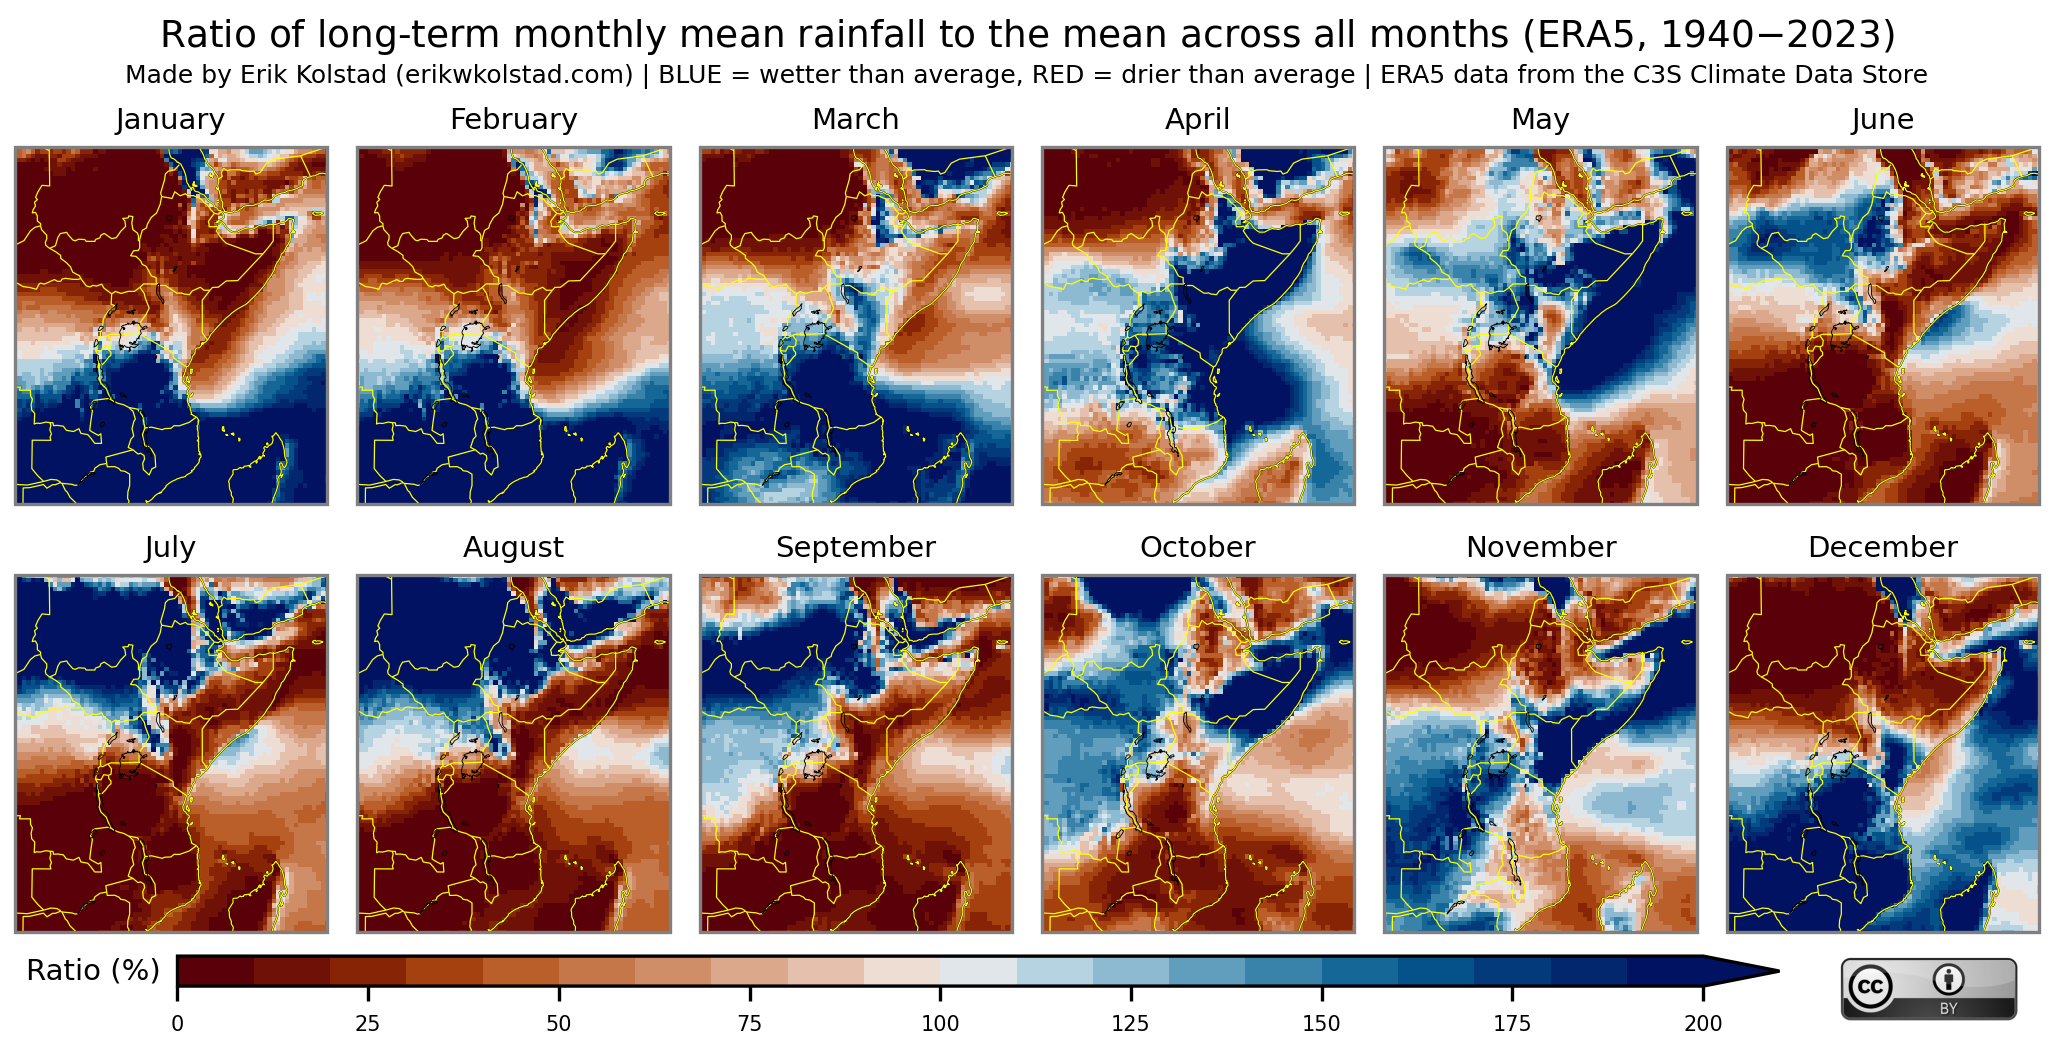
East Africa experiences several rainy seasons, depending on the geographical location. In the figure below, I have computed the long-term monthly mean rainfall for each month and divided this by the long-term monthly mean rainfall across all months. When the ratio is above 100% for a given month, it means that it rains more on average during that month than the average across all months of the year.

Ratio of long-term monthly mean rainfall to the average long-term mean rainfall across all months, based on ERA5 reanalysis from 1940 to 2023.

Taking Ethiopia as an example, we see that the entire country experiences dry conditions from December to February, also known as the Bega period. The Belg rainy season in the central and eastern parts of the country starts in February/March and lasts until May. In western and central Ethiopia, the Kiremt season starts in May/June and lasts until September. There is then an abrupt shift to dry conditions in the western areas in October. In the same month, wet conditions start in the central and eastern regions. This rainy season, which is known more broadly as the East African «short rains», persists until November in the southern part of the country.

Malawi is another interesting case. This country is mainly dry between April/May and November, and mainly wet from November/December to April/May. In other words, there is a long lean season and a long, single rainy season. From year to year there can be large variations from this average pattern, however.

Global December 2023 temperatures ranked

Here’s a map that shows the overall rank of December 2023 amongst all the December months since 1960:

Rank of December 2023 monthly mean 2-metre temperature in the period 1960–2023, where rank 1 means that December 2023 was the warmest in the period. The ranking is based on monthly mean temperatures from the ERA5 reanalysis (downloaded from the Copernicus Climate Change Service).

Deep red, orange and yellow colours indicate places where December 2023 was amongst the three warmest years, but note that the other red colours also indicate that December 2023 was high on the list.

I emphasise that the map is based on monthly mean temperatures, which include the temperatures for every day of the month. It also includes nighttime temperatures. A map based on average daily maximum temperatures might look different.

How warm was July 2023?

There were heat waves in Europe, China, North America, and even South America (during winter) in July 2023. Here’s a map that shows the overall rank of July 2023 amongst all the July months since 1960:

Rank of July 2023 monthly mean 2-metre temperature in the period 1960–2023, where rank 1 means that July 2023 was the warmest in the period. The ranking is based on monthly mean temperatures from the ERA5 reanalysis (downloaded from the Copernicus Climate Change Service), and the grid spacing is 0.5 degrees.

Deep red, orange and yellow colours indicate places where July 2023 was amongst the three warmest years, but note that the other red colours also indicate that July 2023 was high on the list.

I emphasise that the map is based on monthly mean temperatures, which include the temperatures for every day of the month. It also includes nighttime temperatures.

An atlas of seasonal correlations between El Niño and La Niña and temperature and precipitation

Update (May 2026): I have updated these maps using data up to February 2026 here.

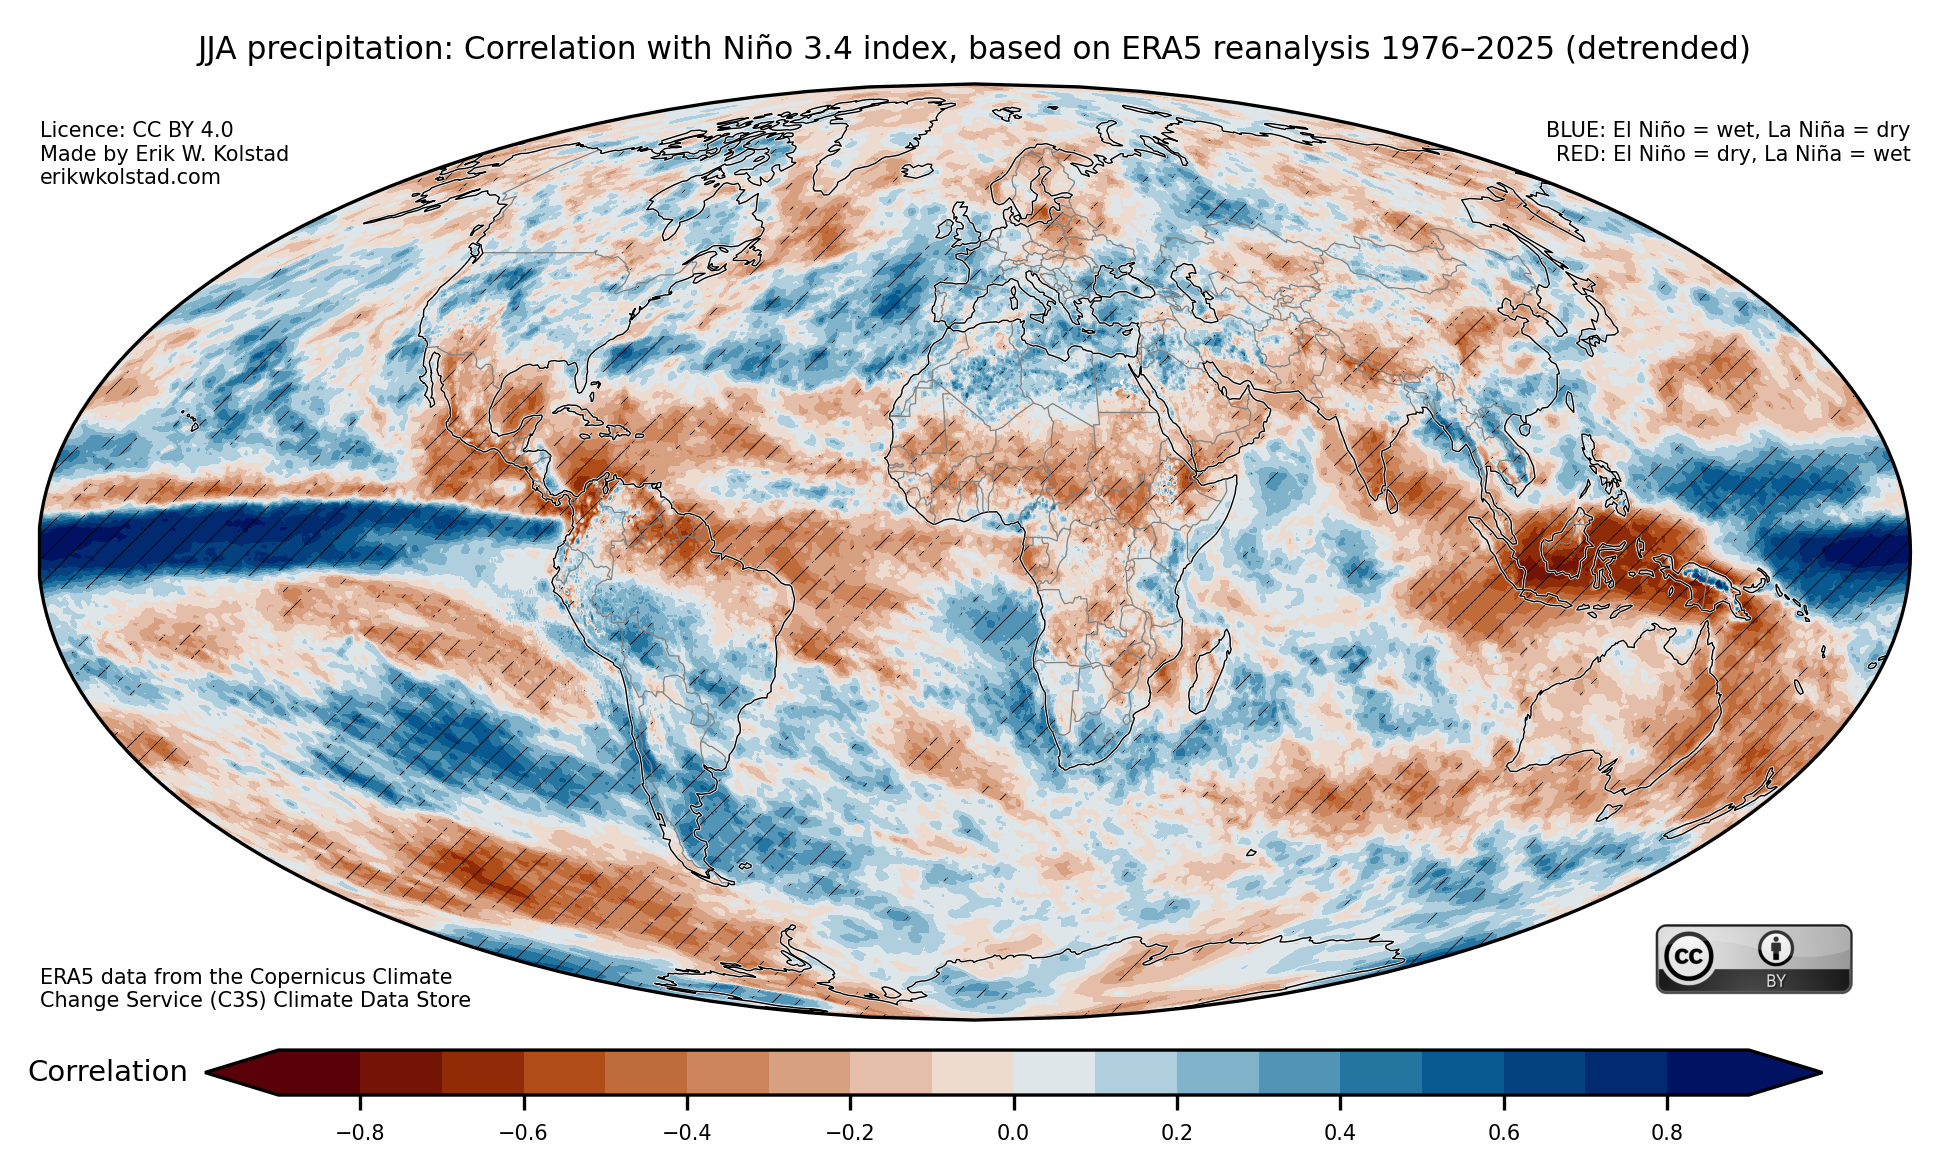
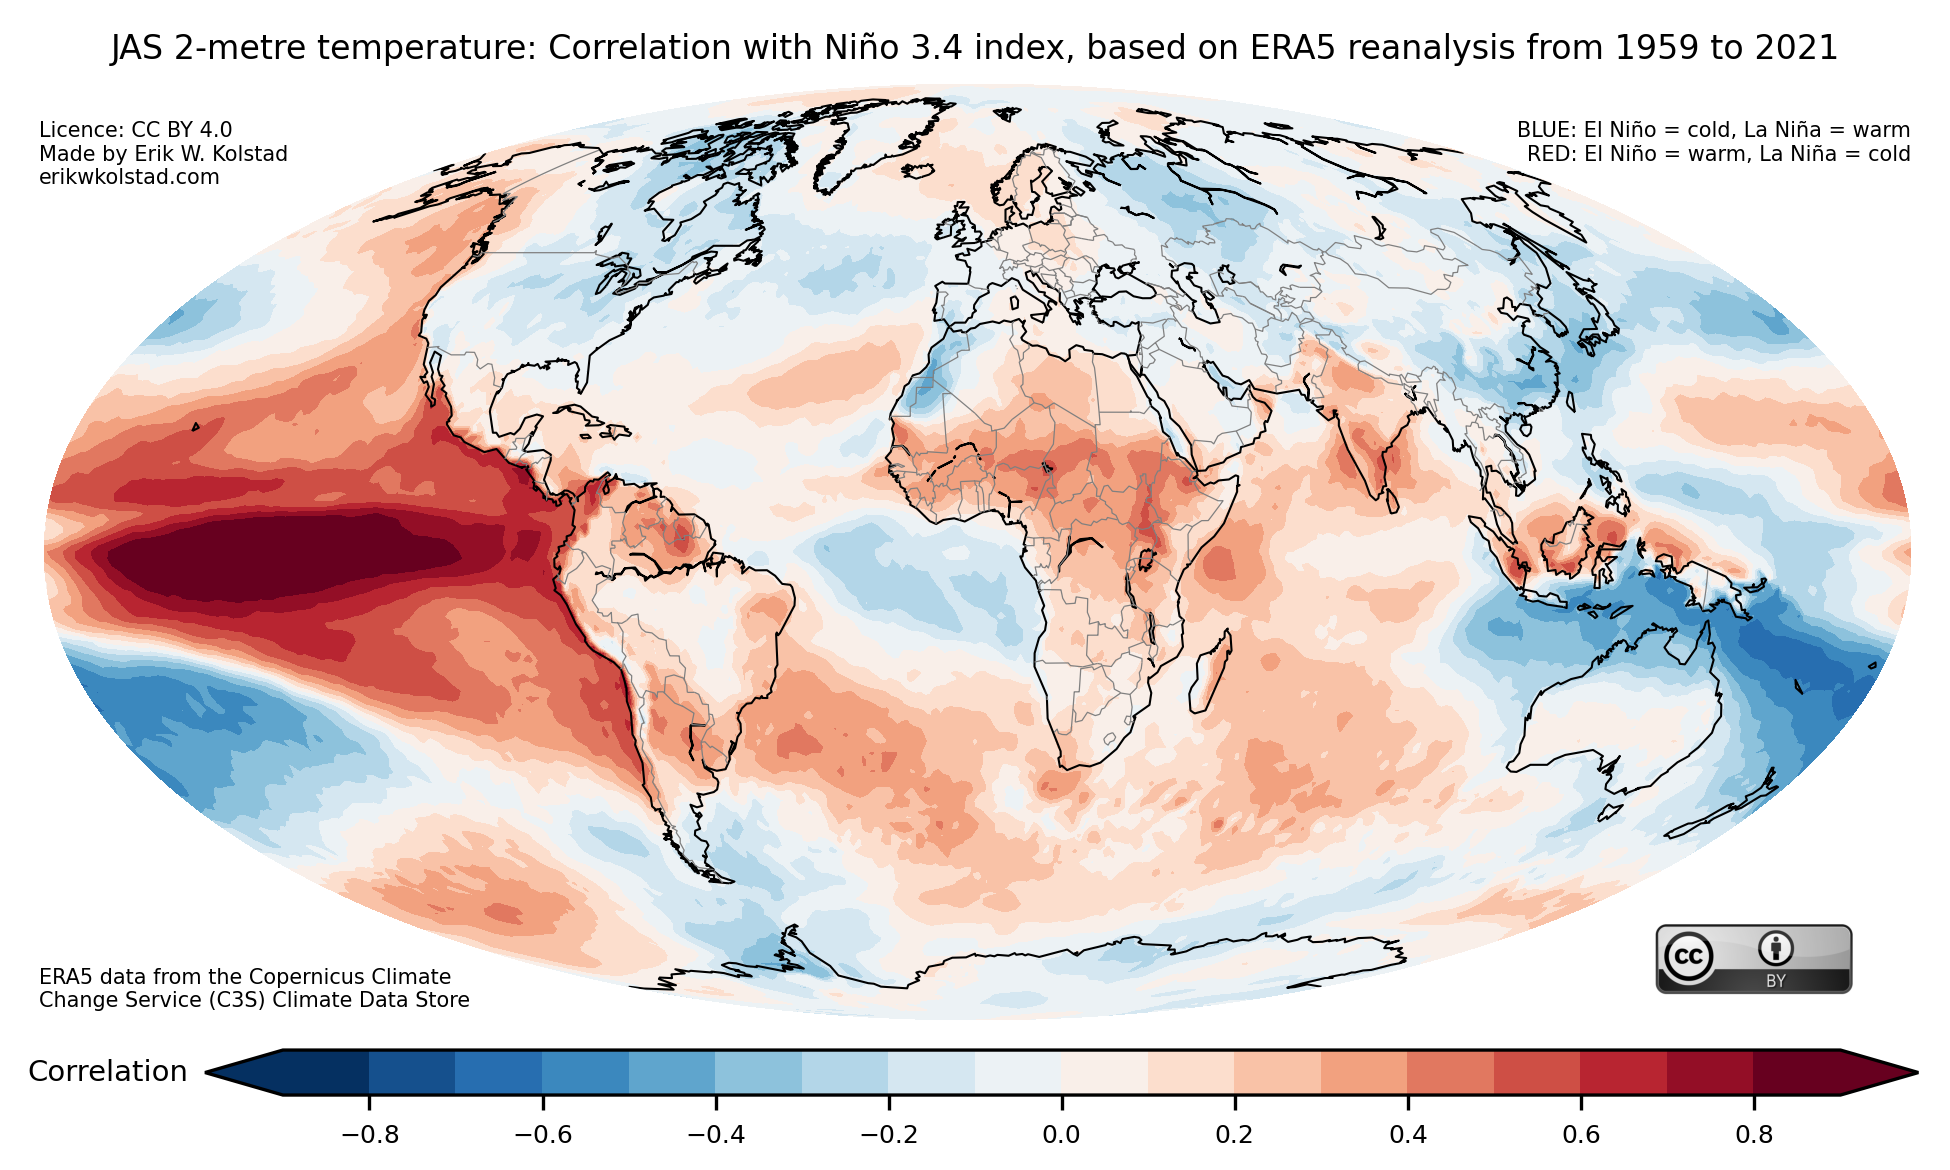
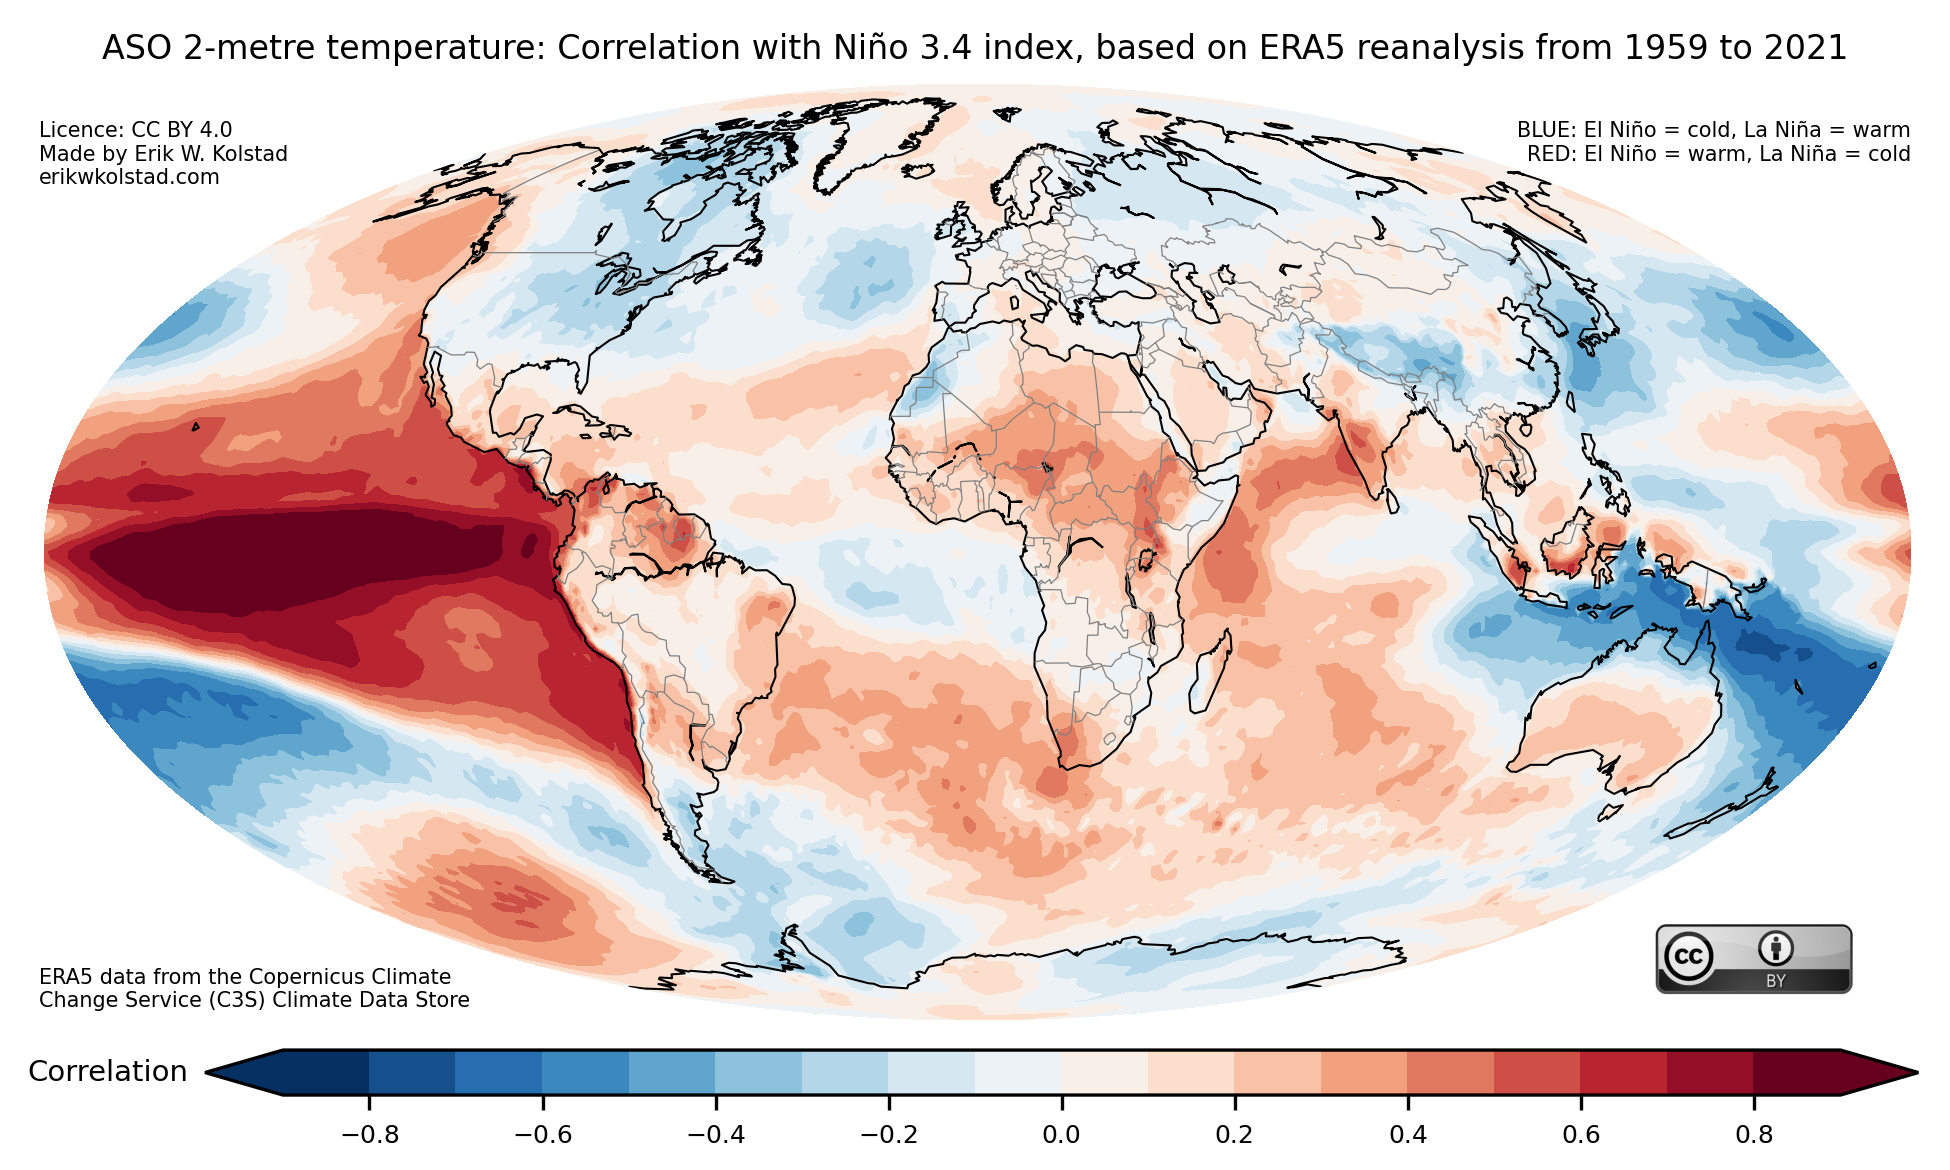
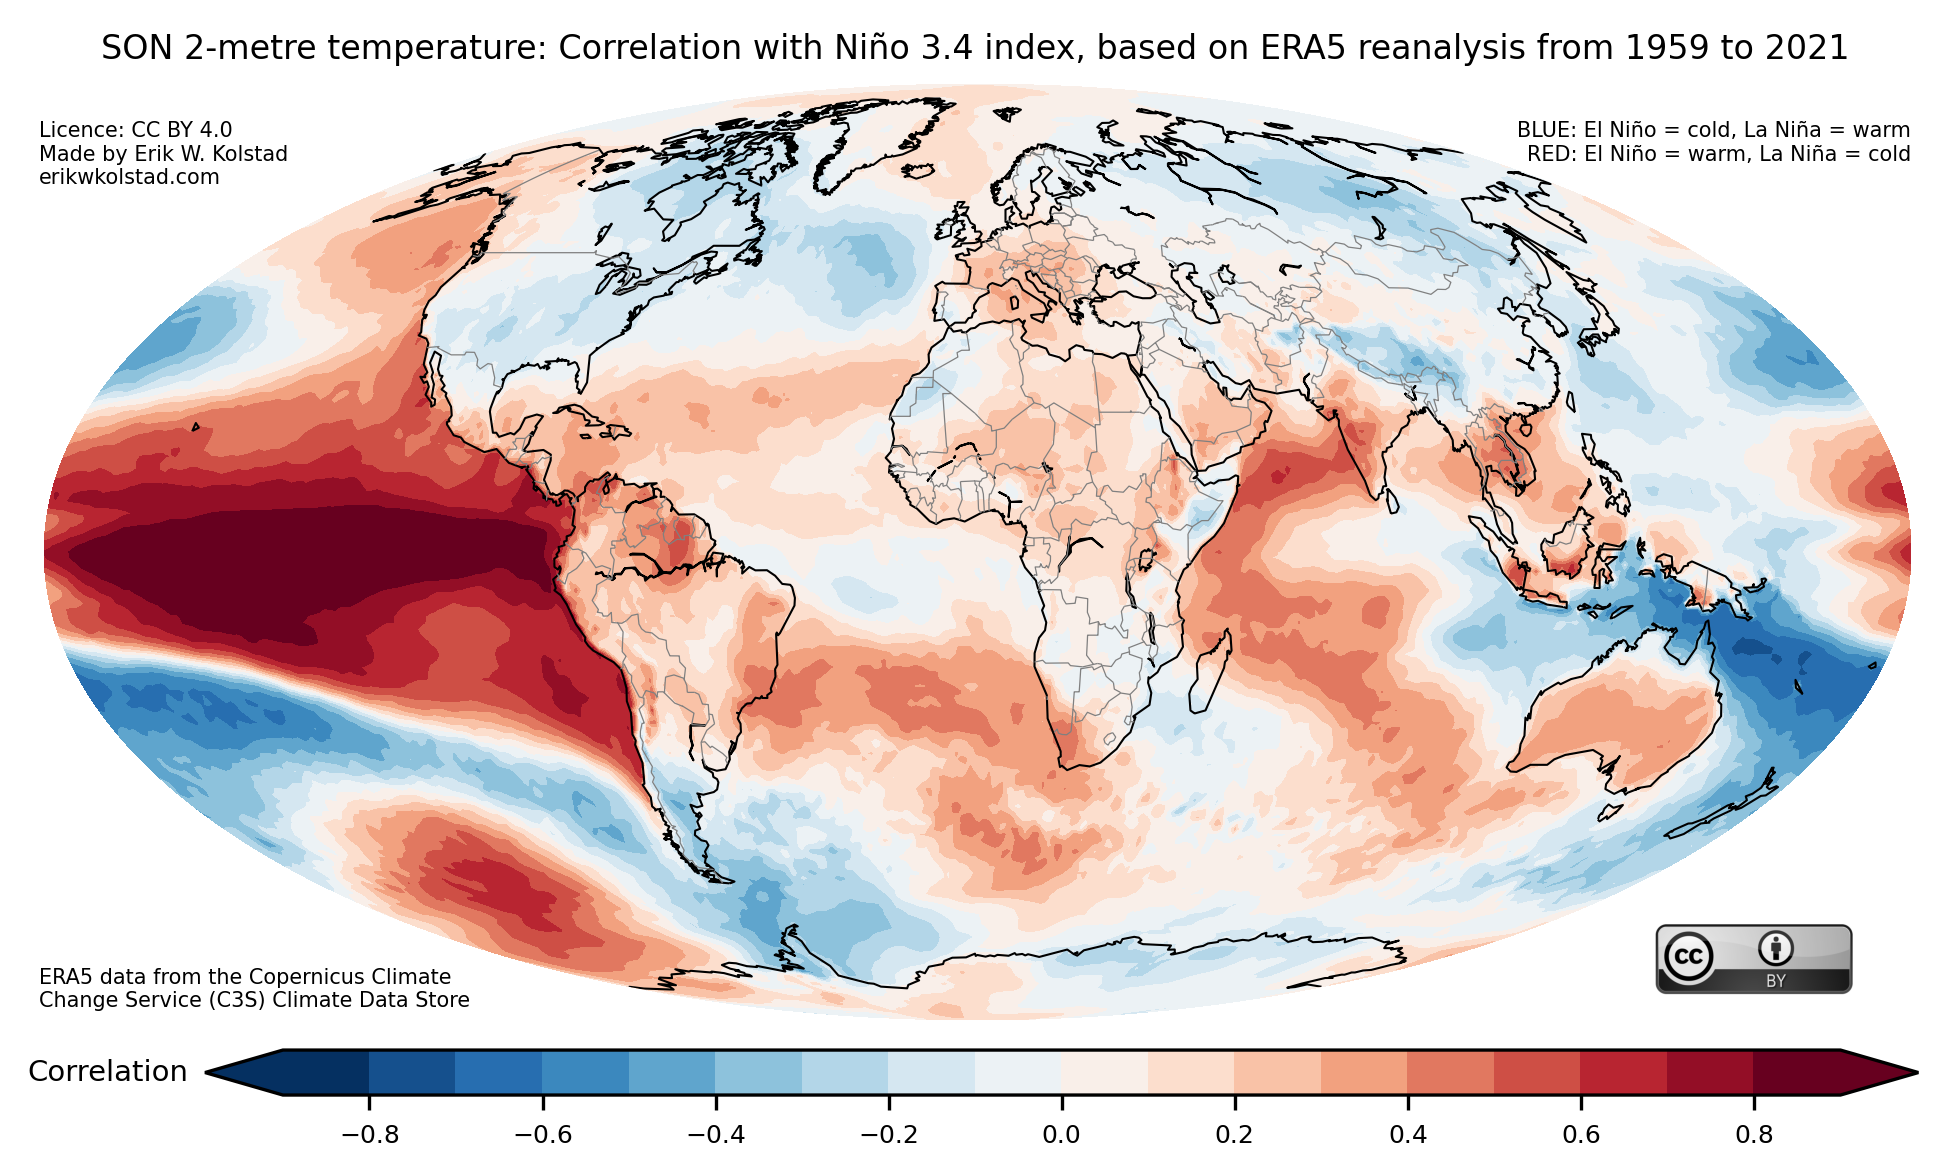
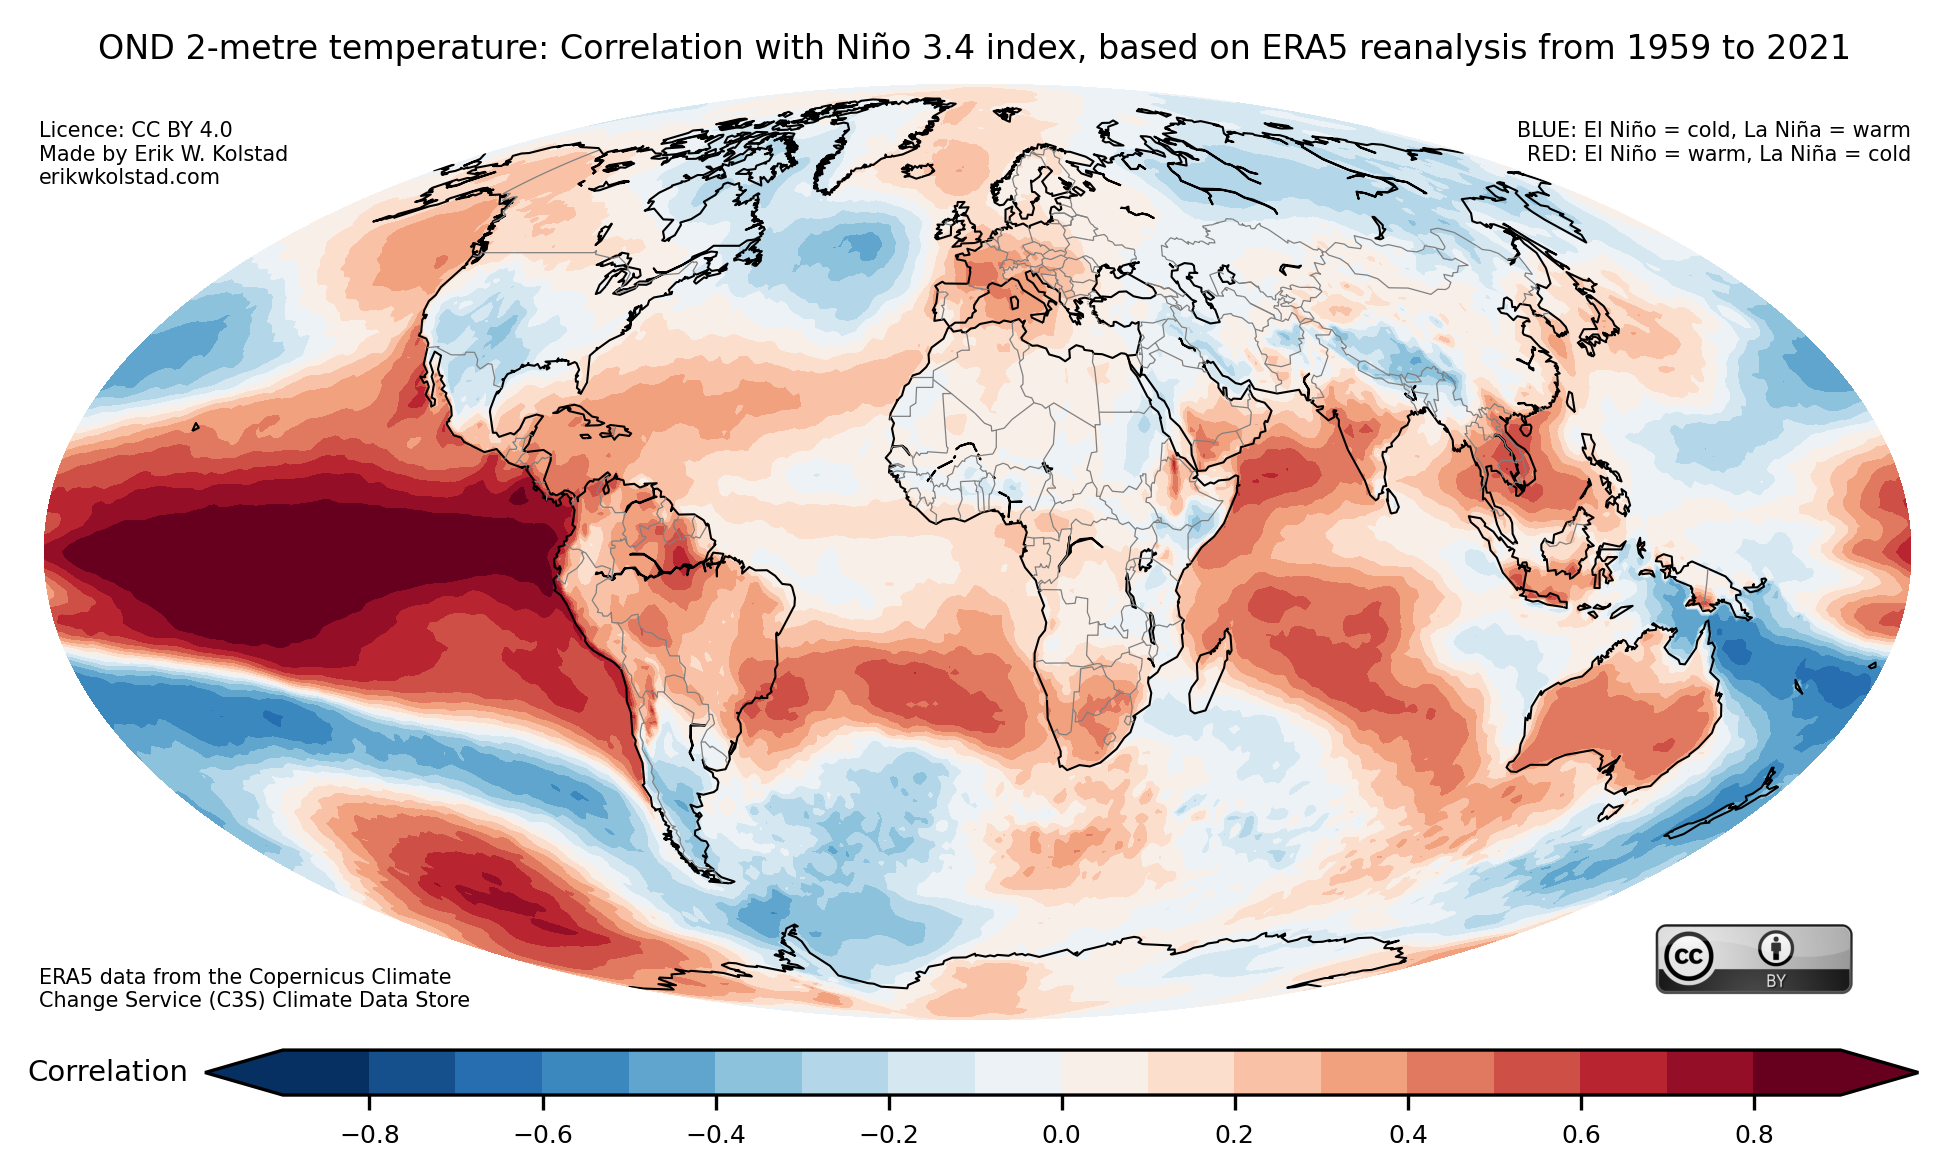
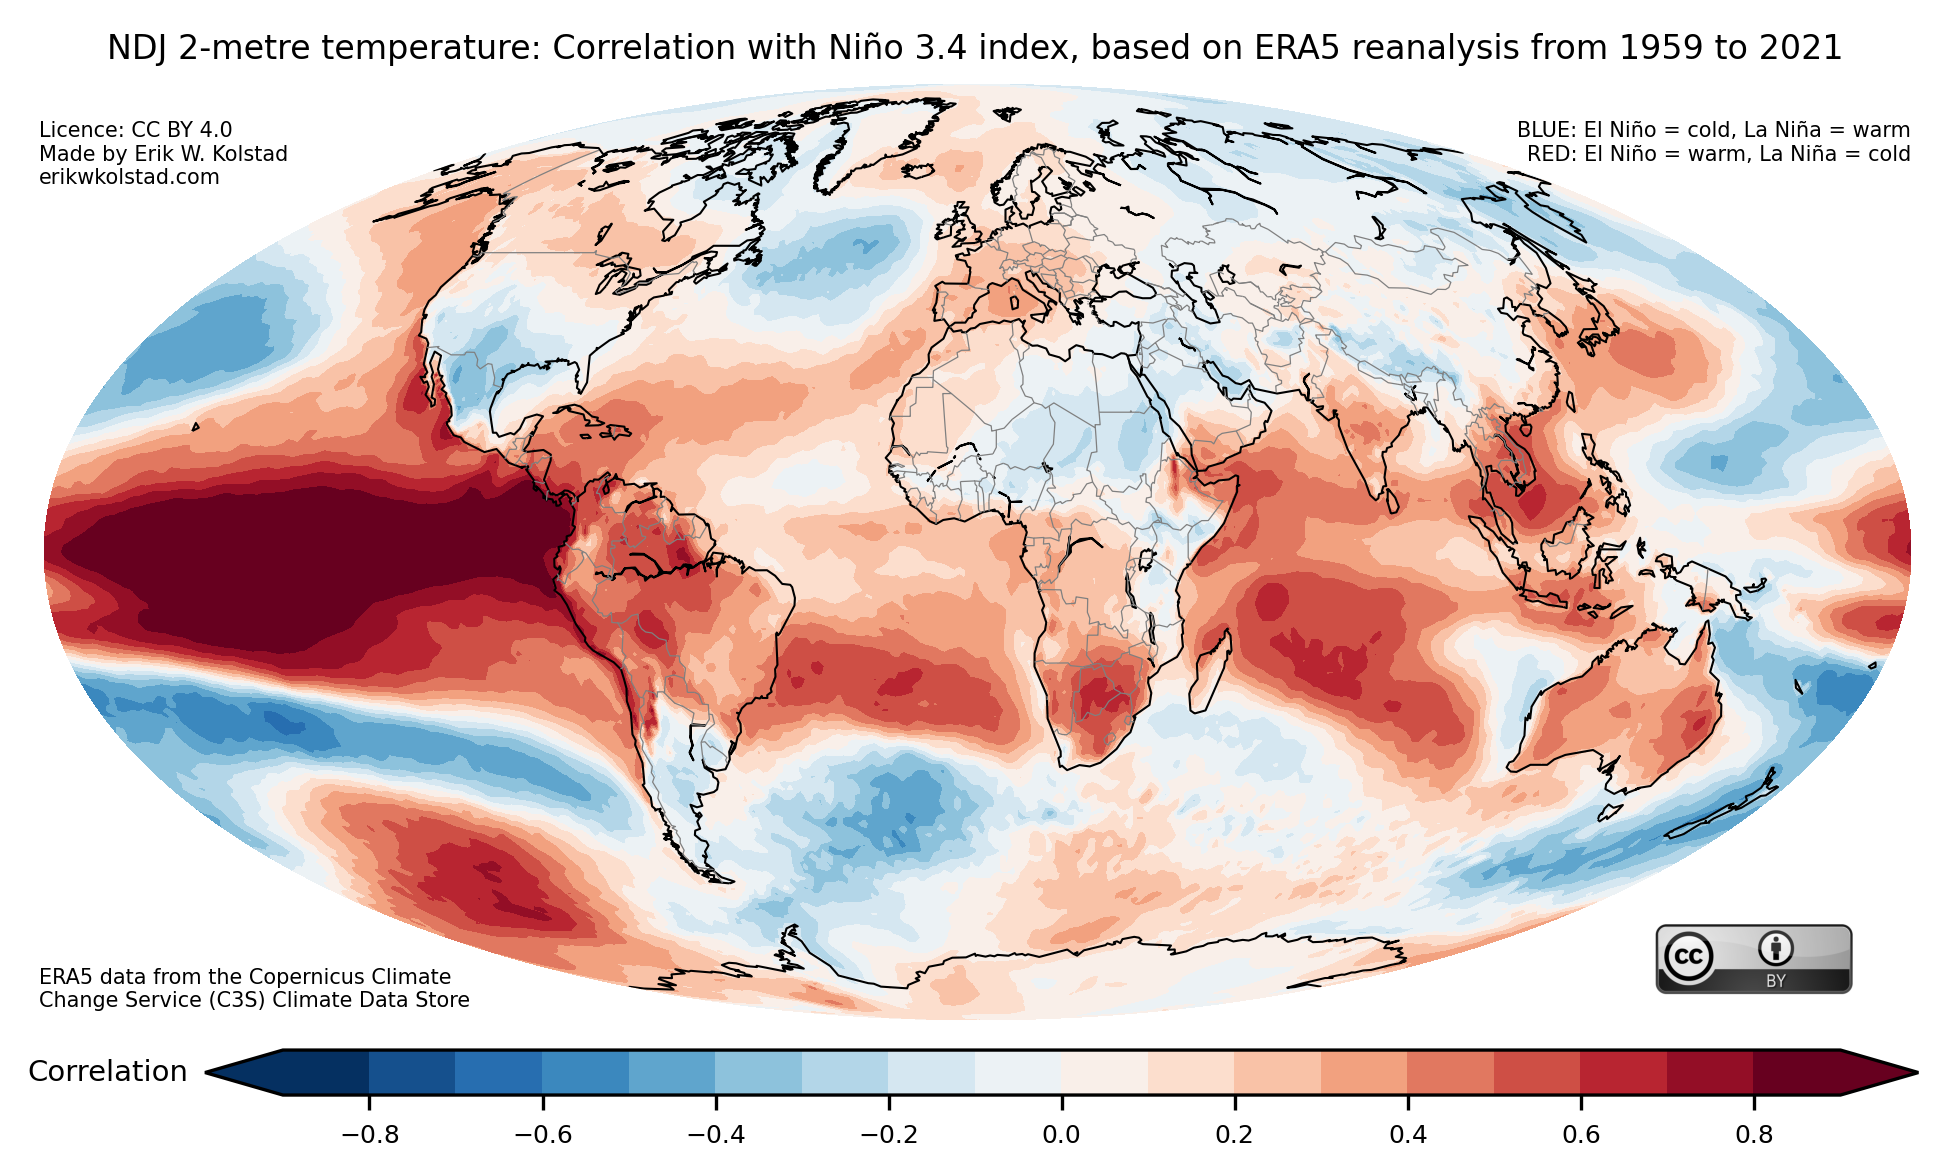
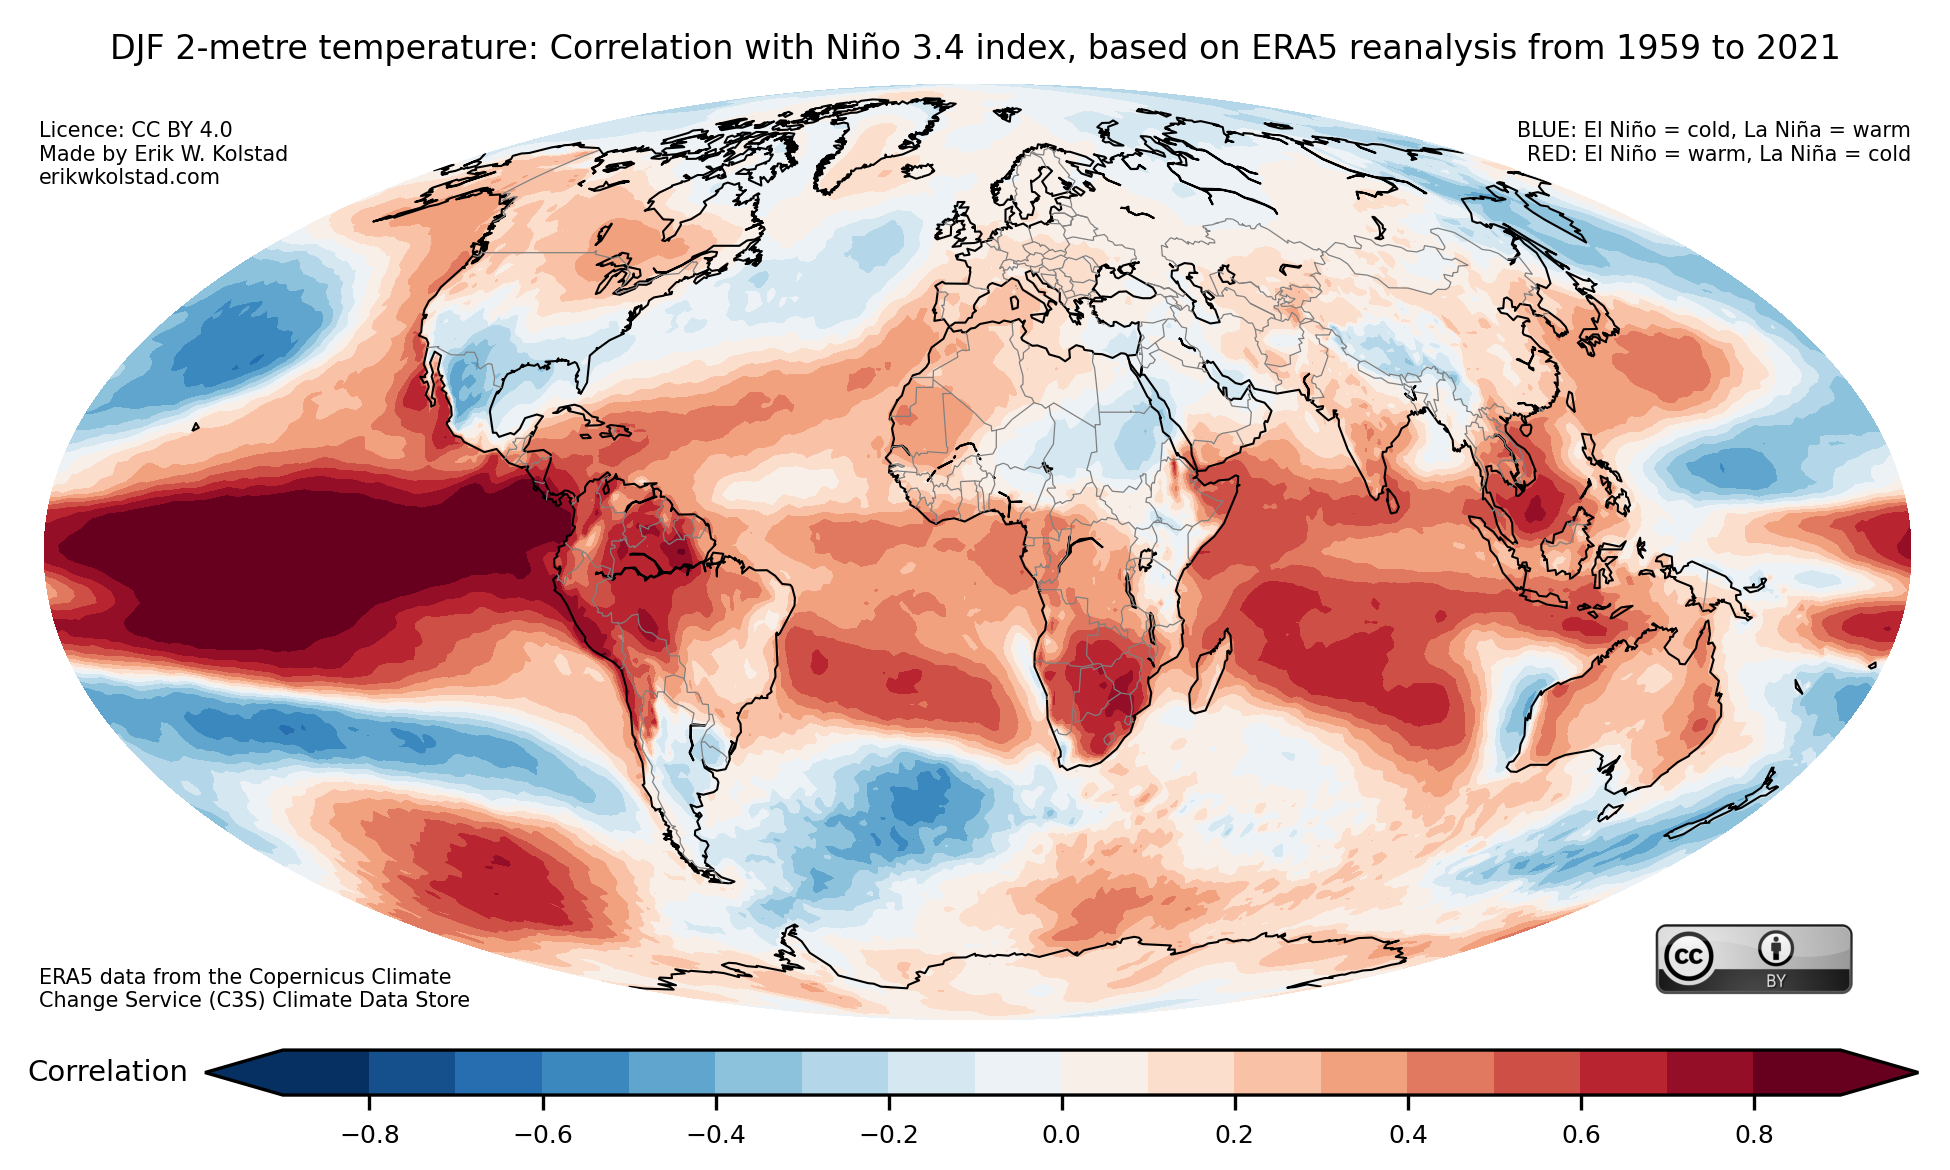
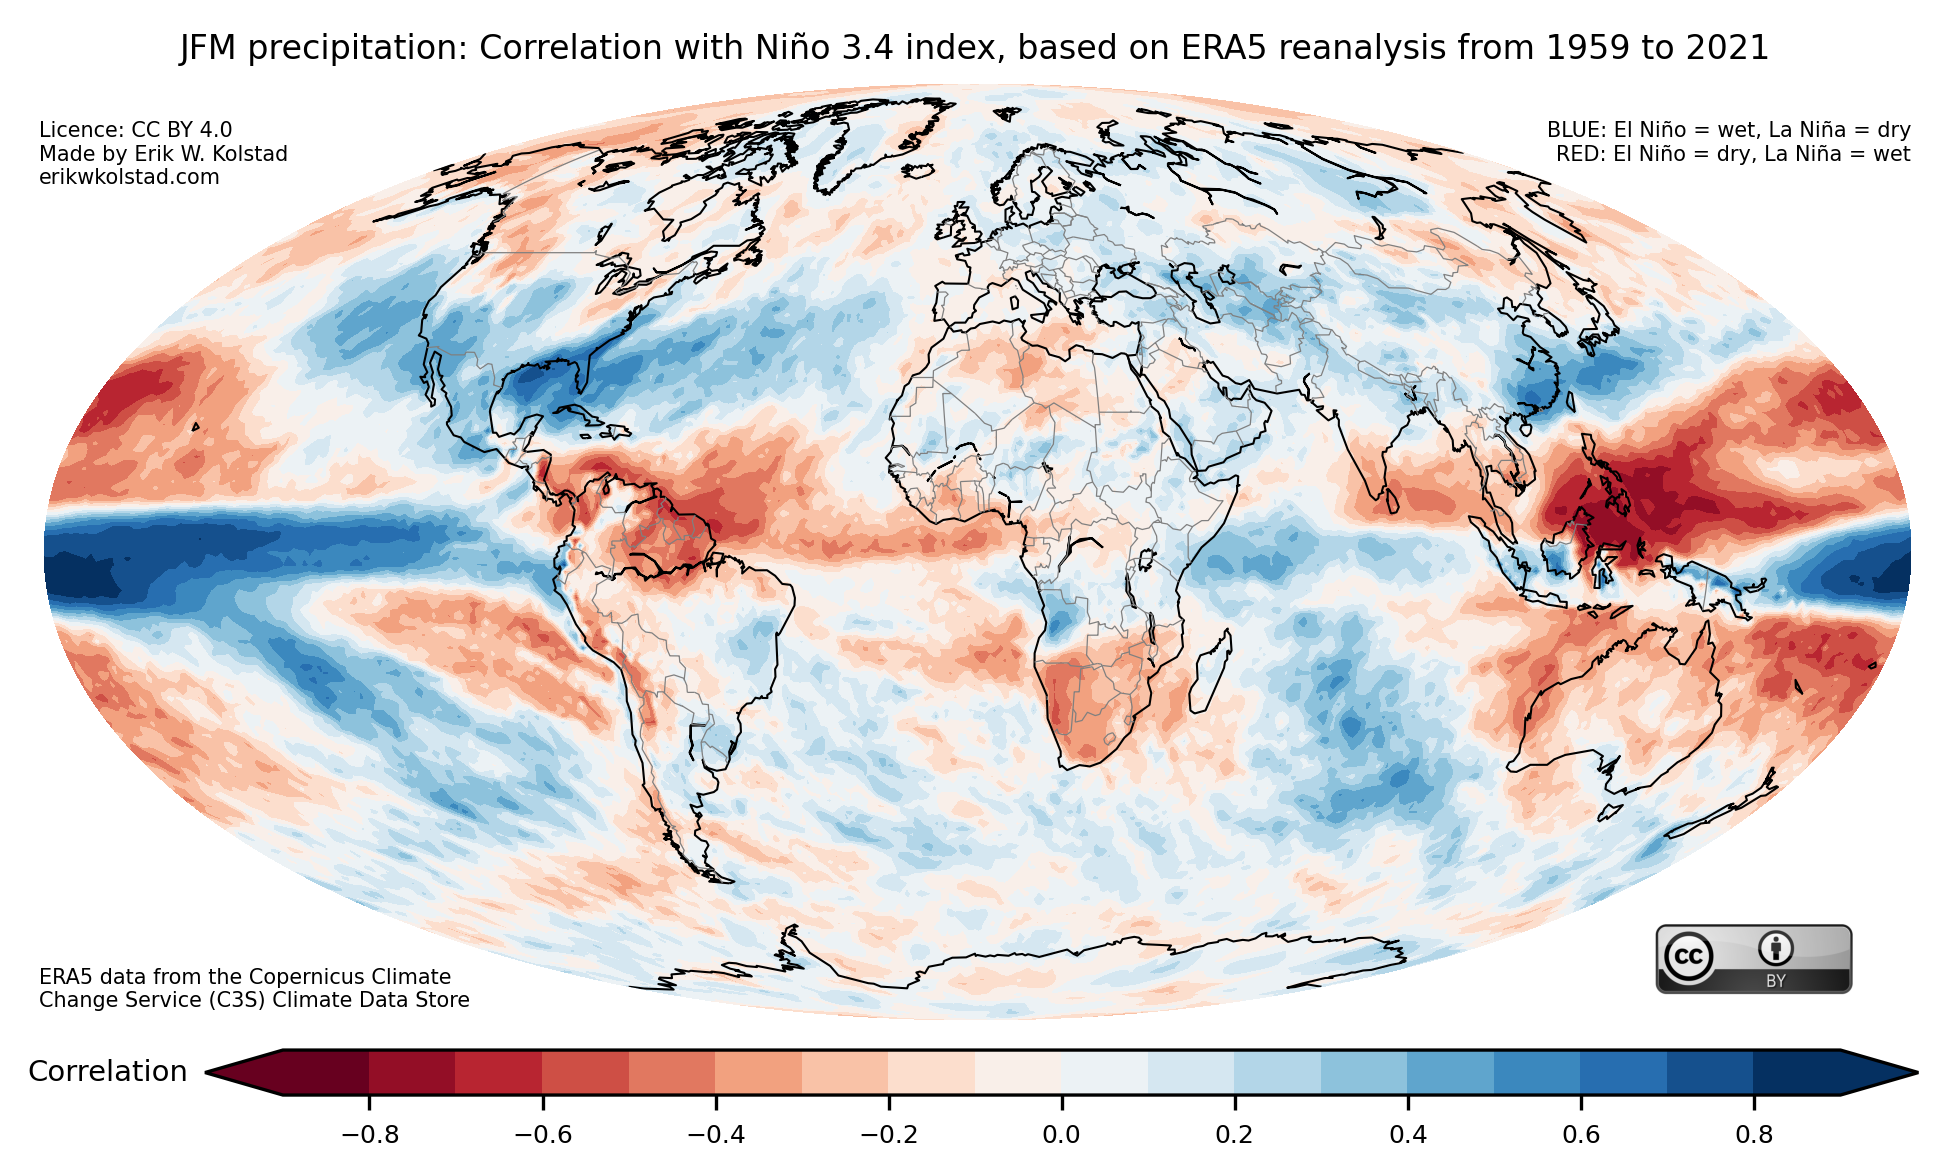
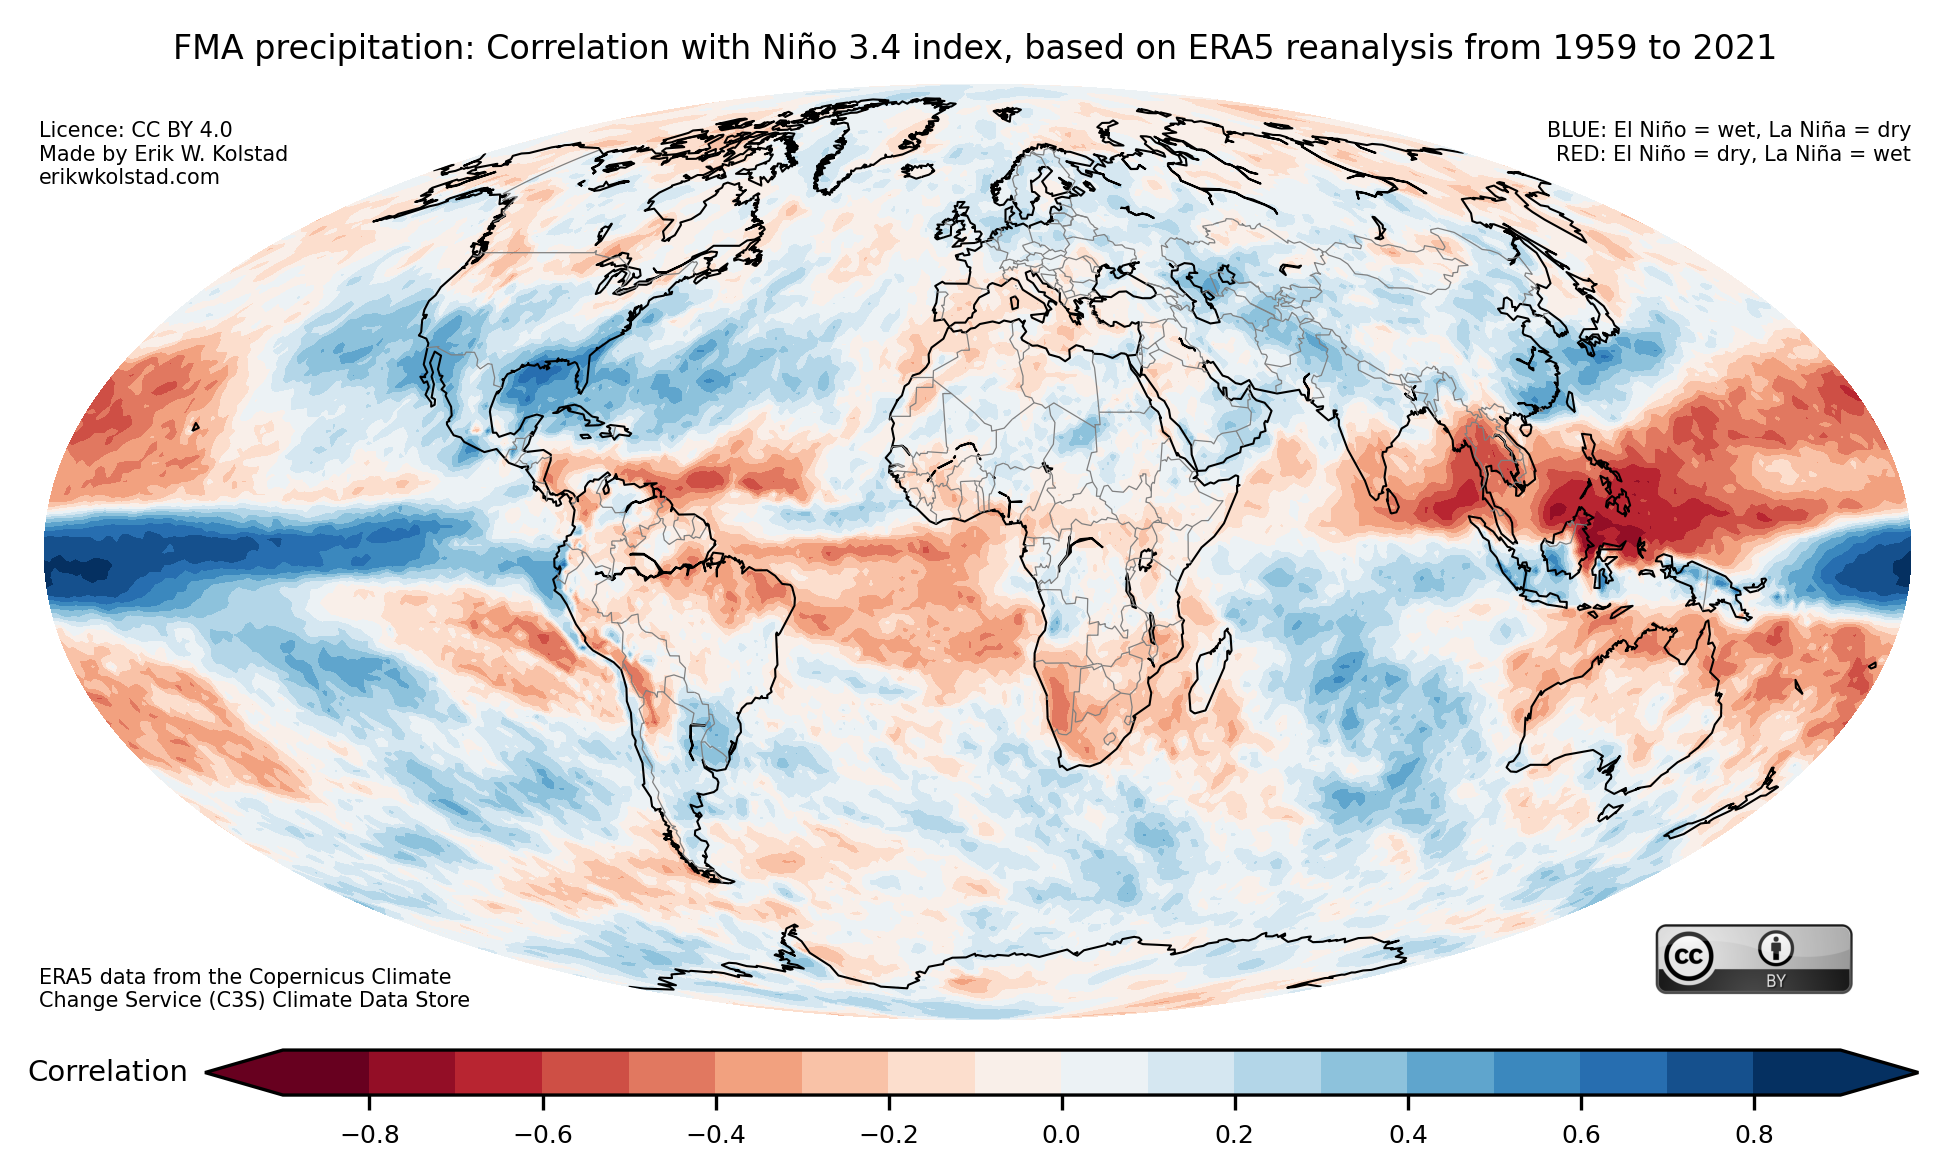
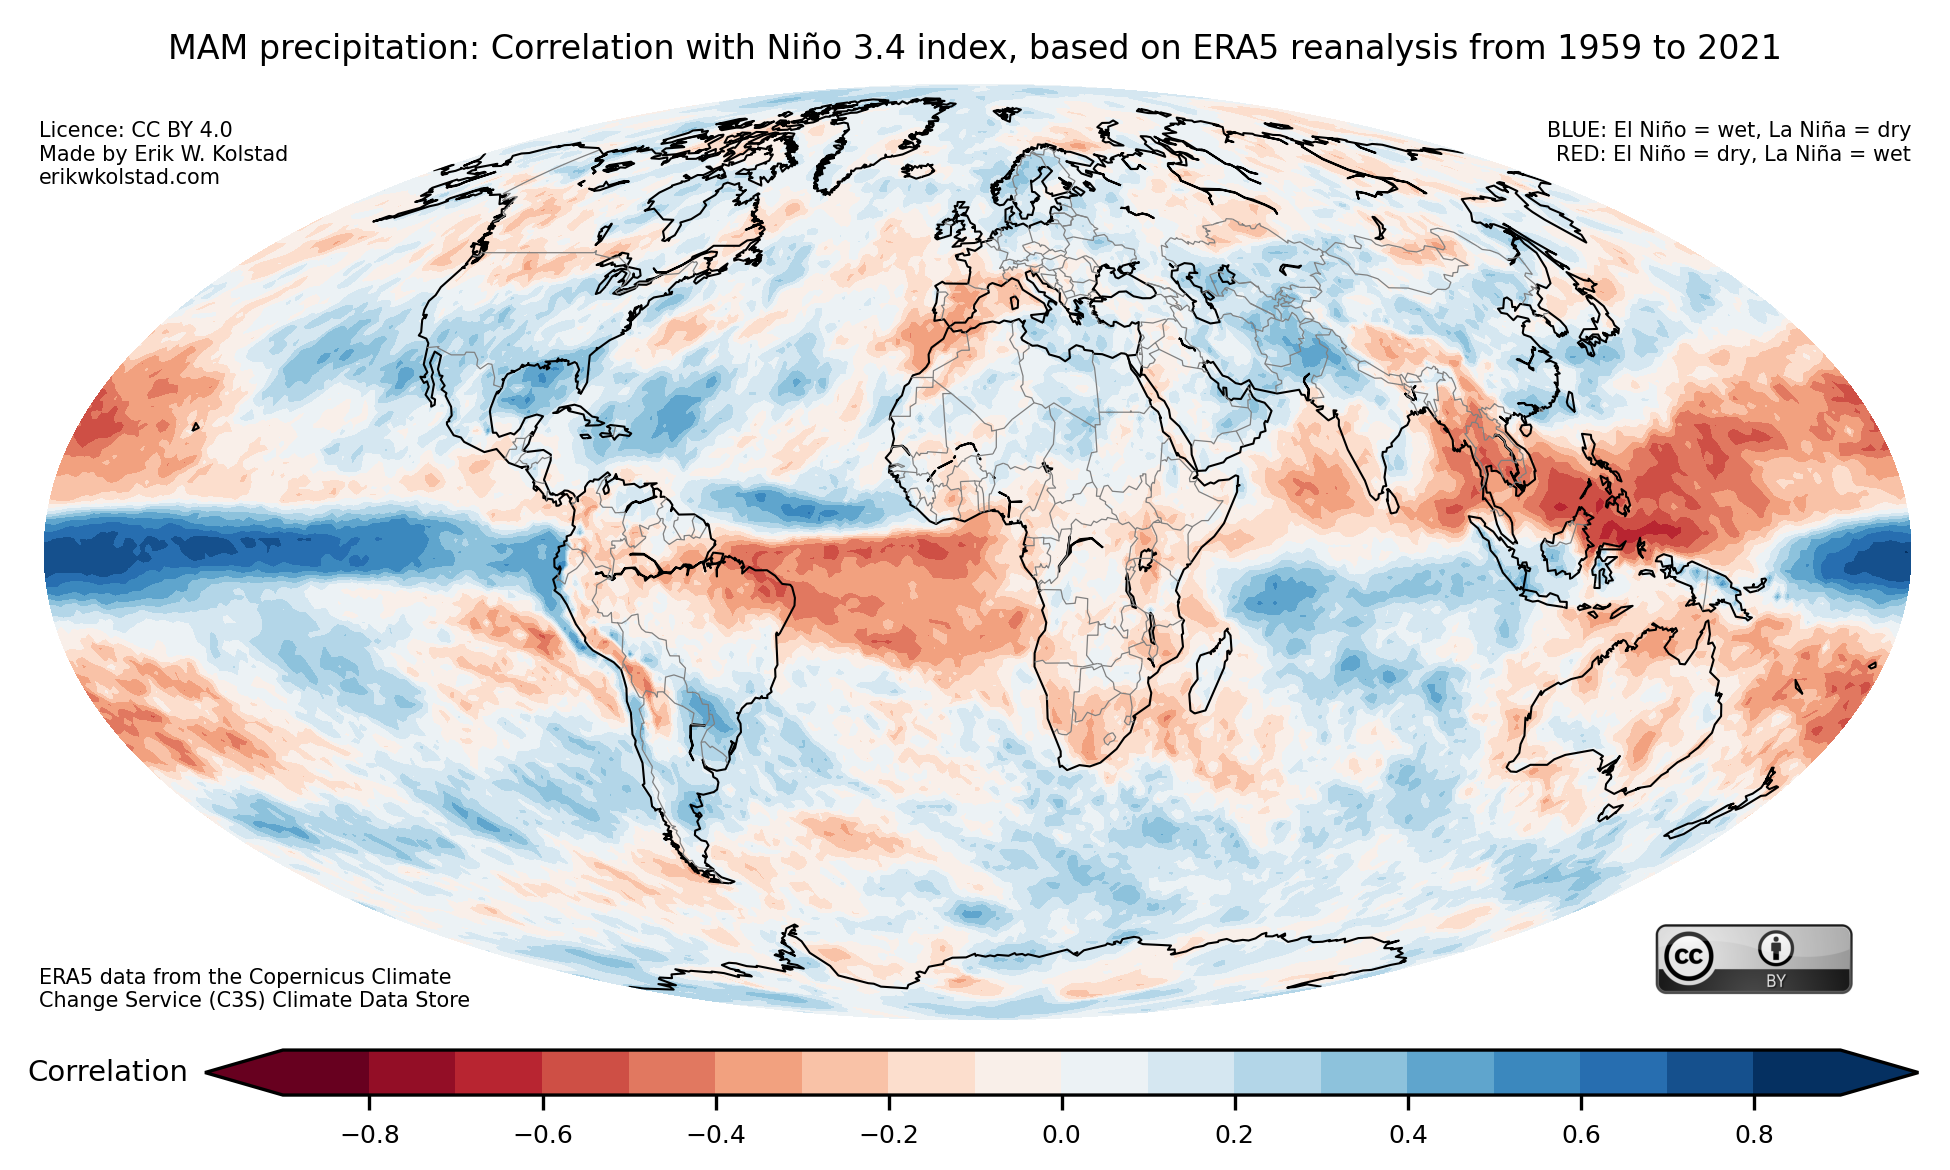
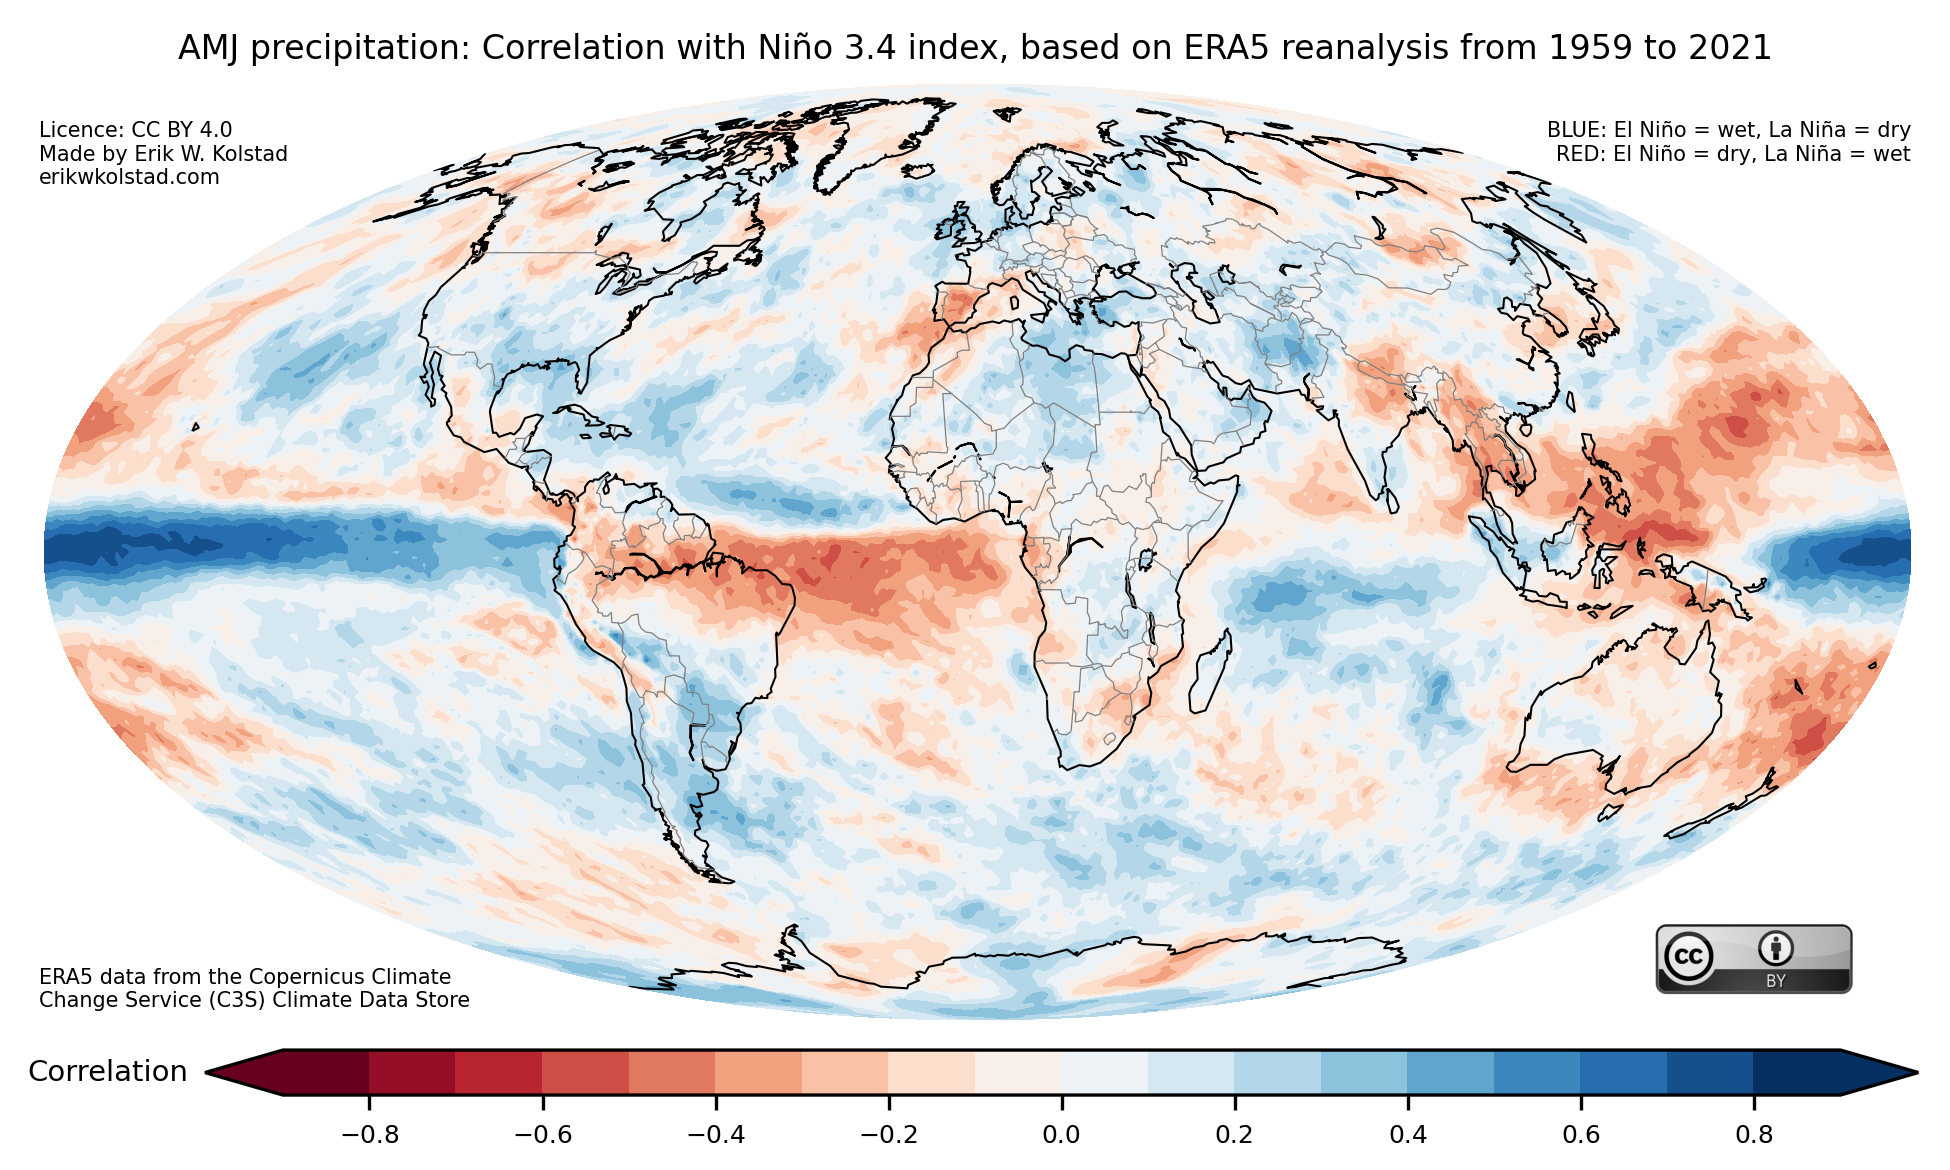
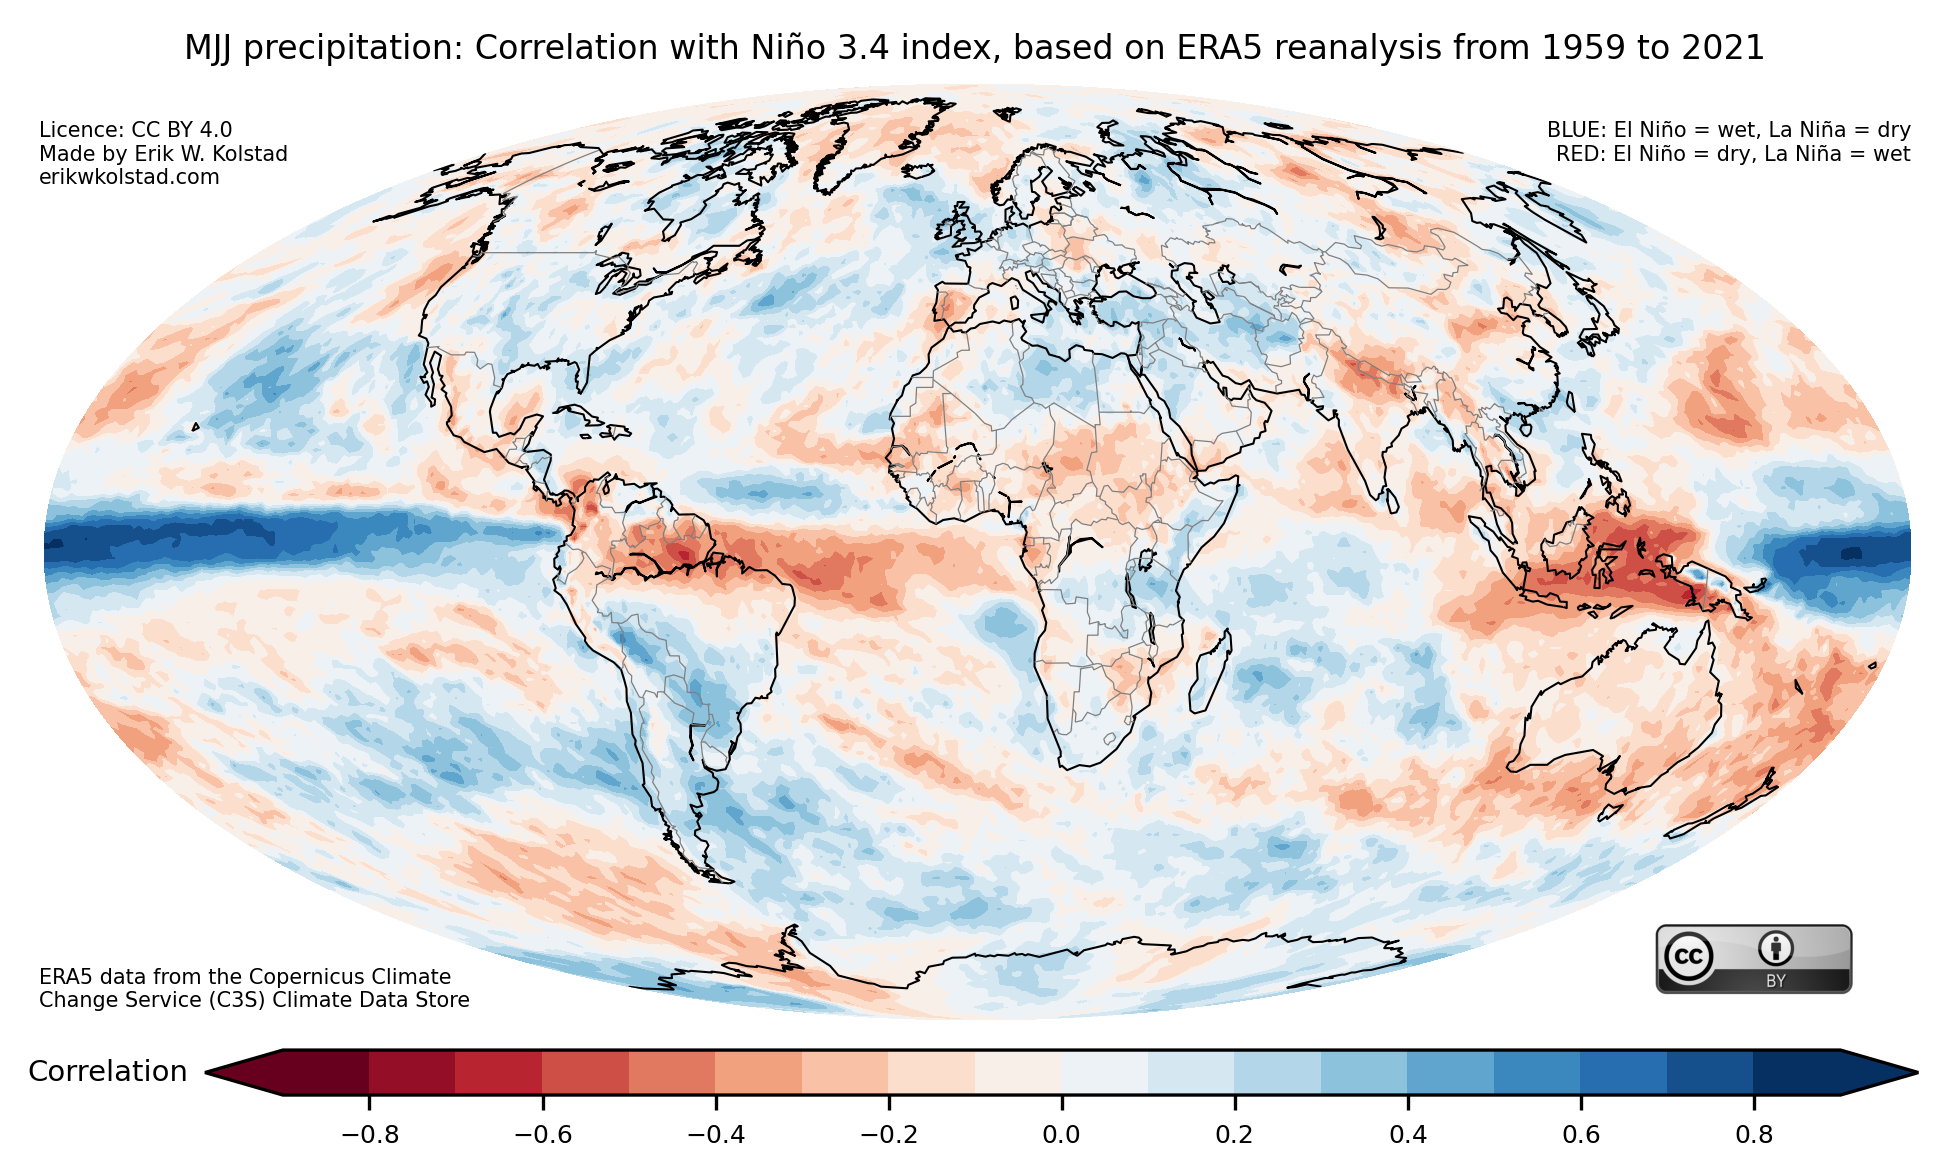
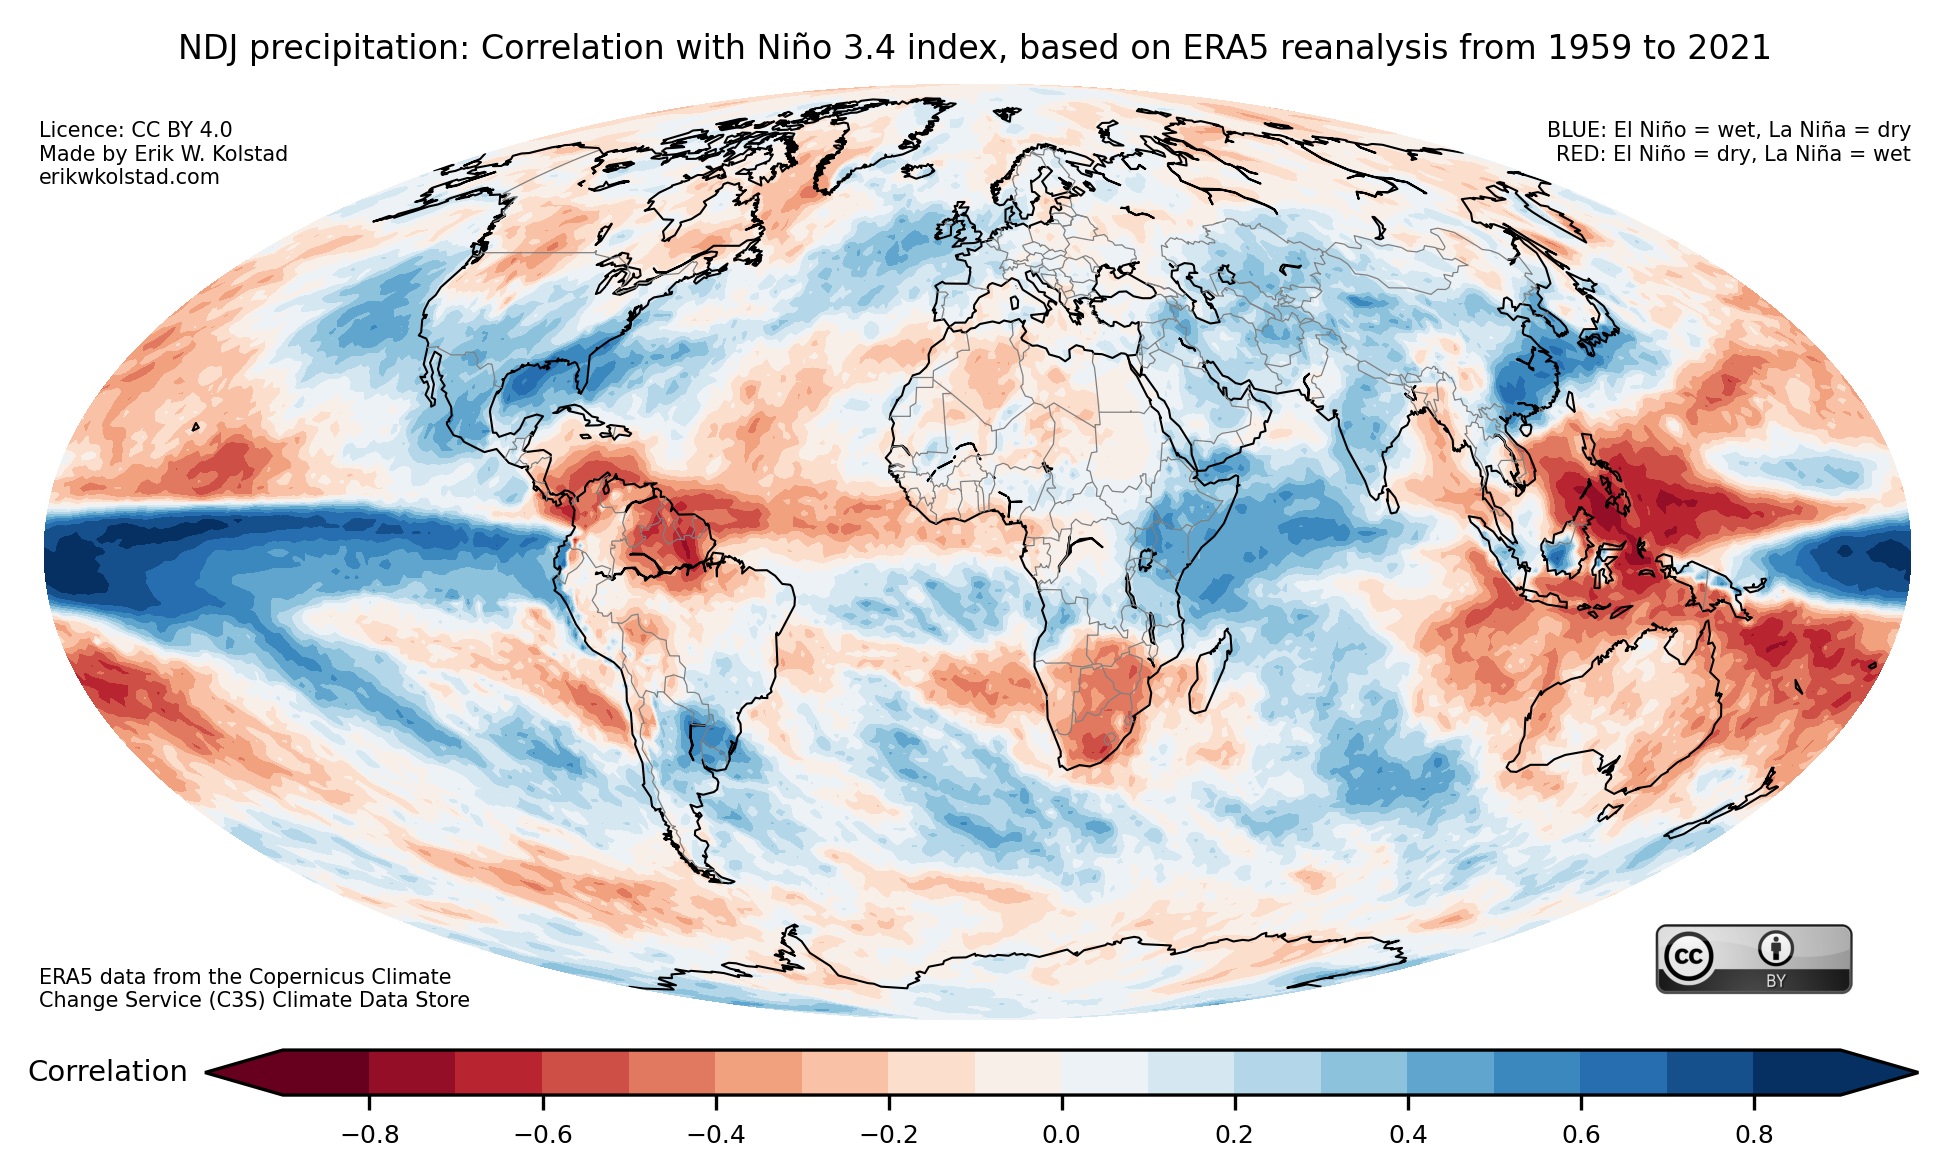
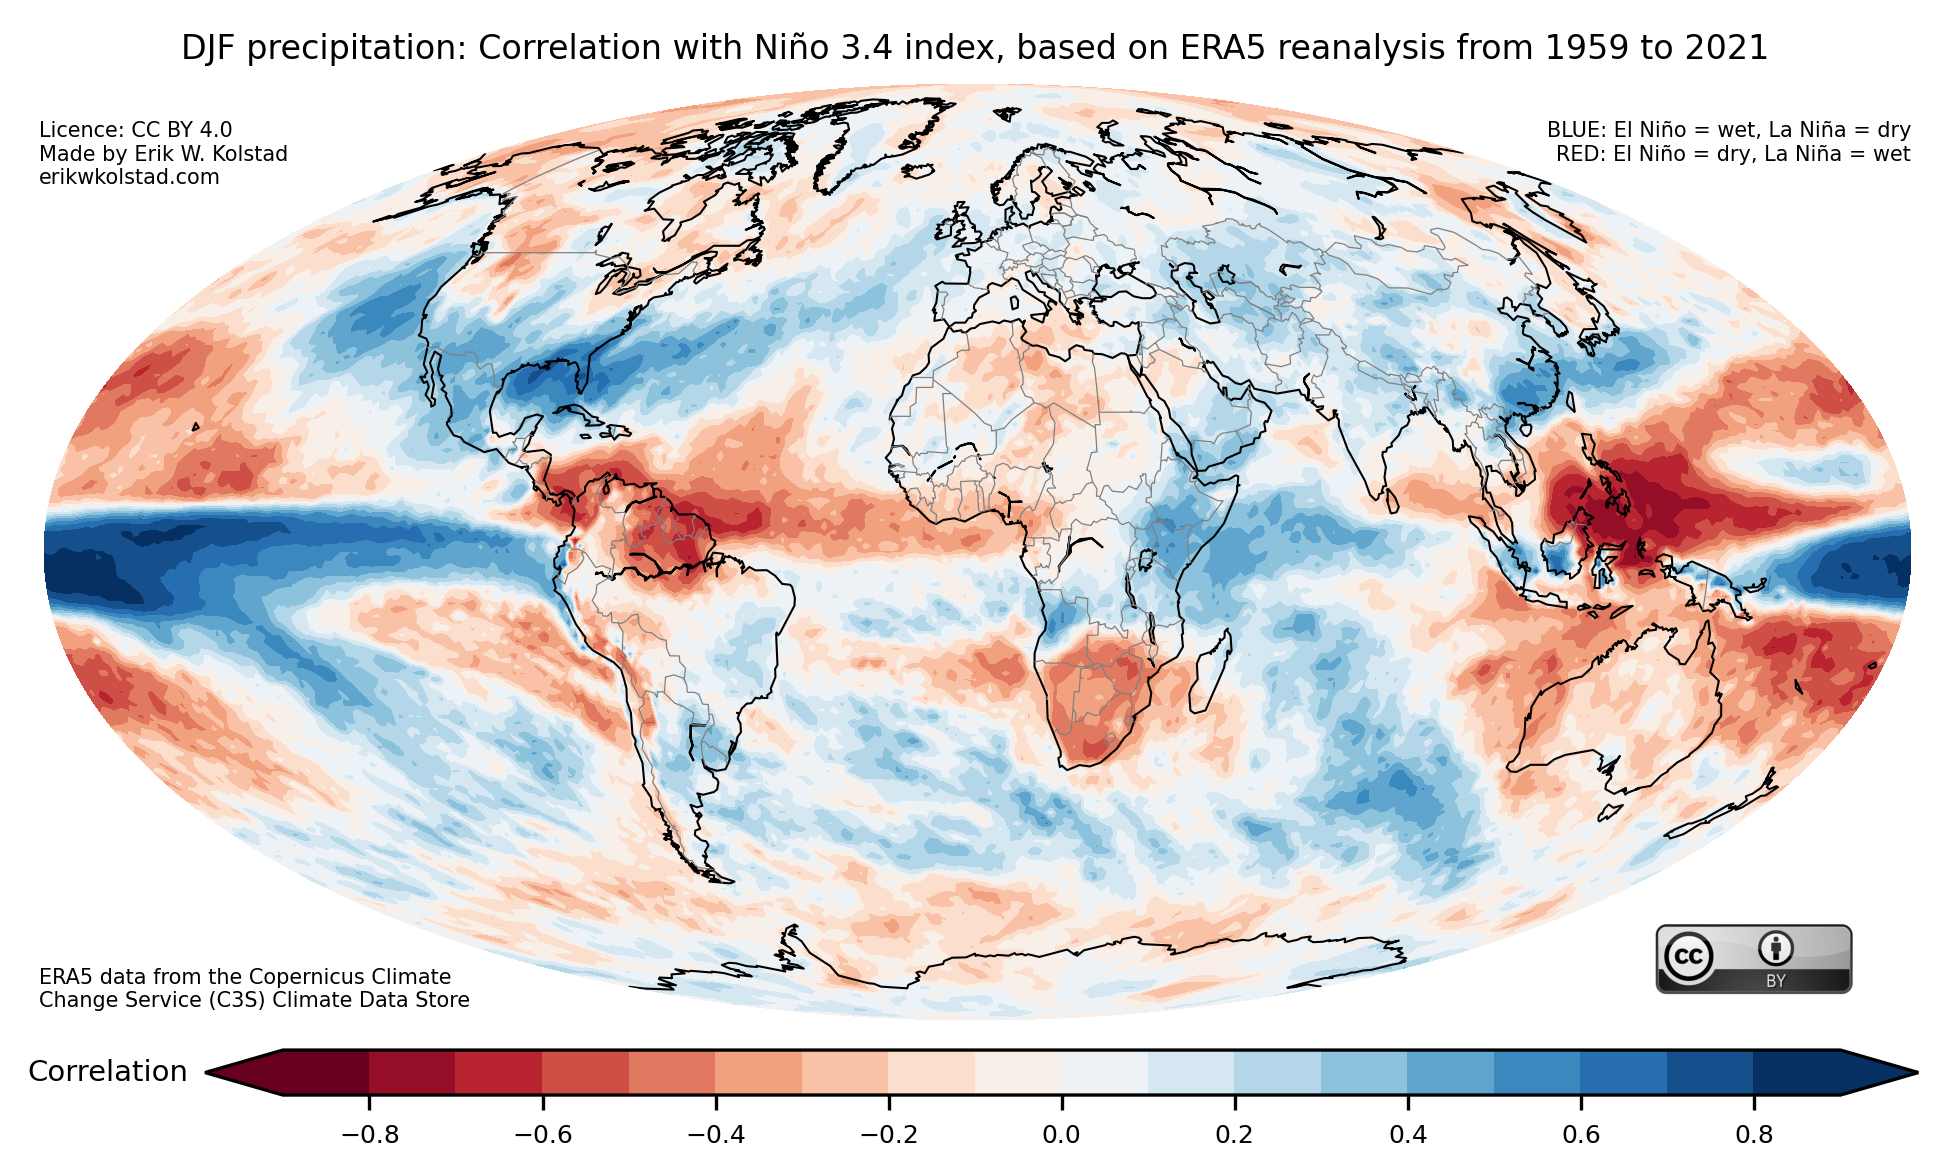
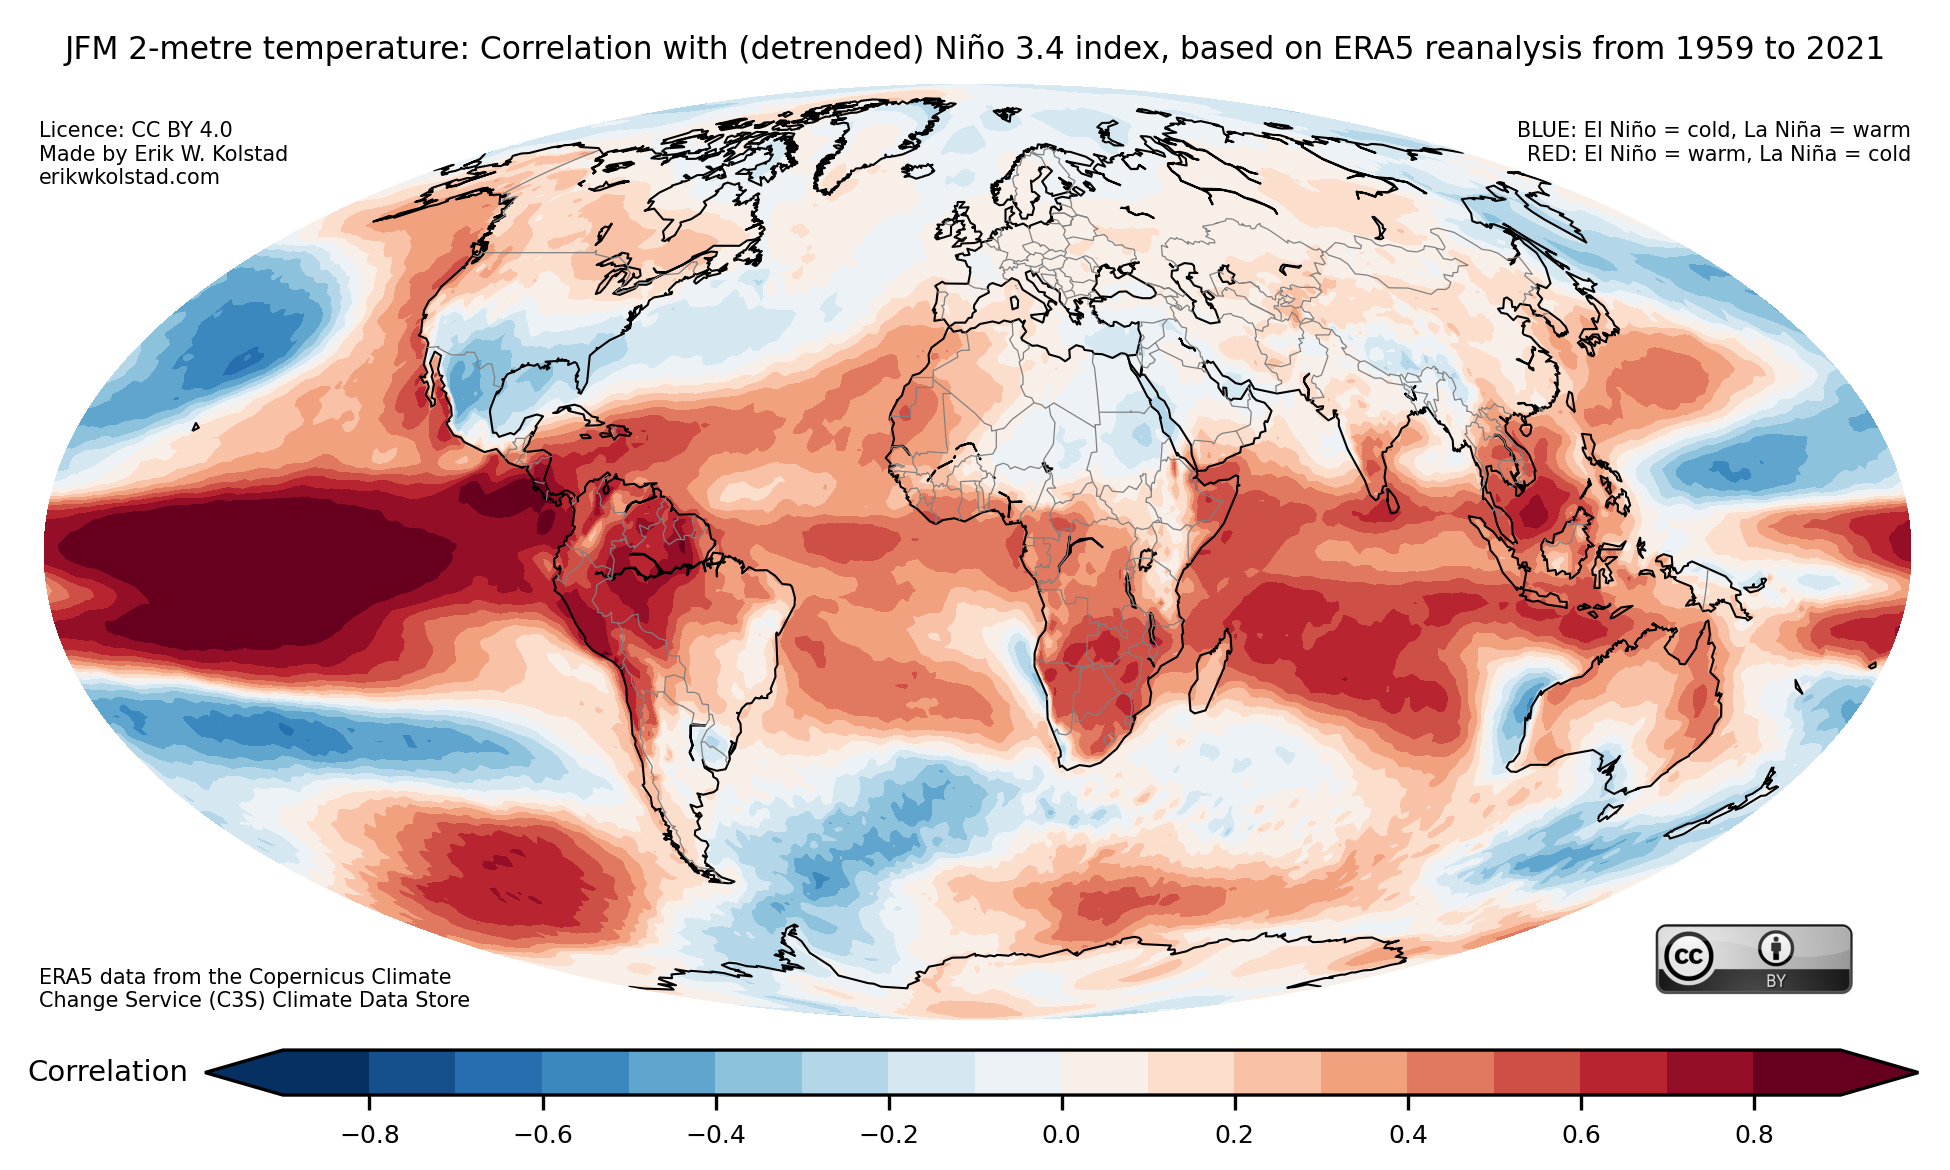
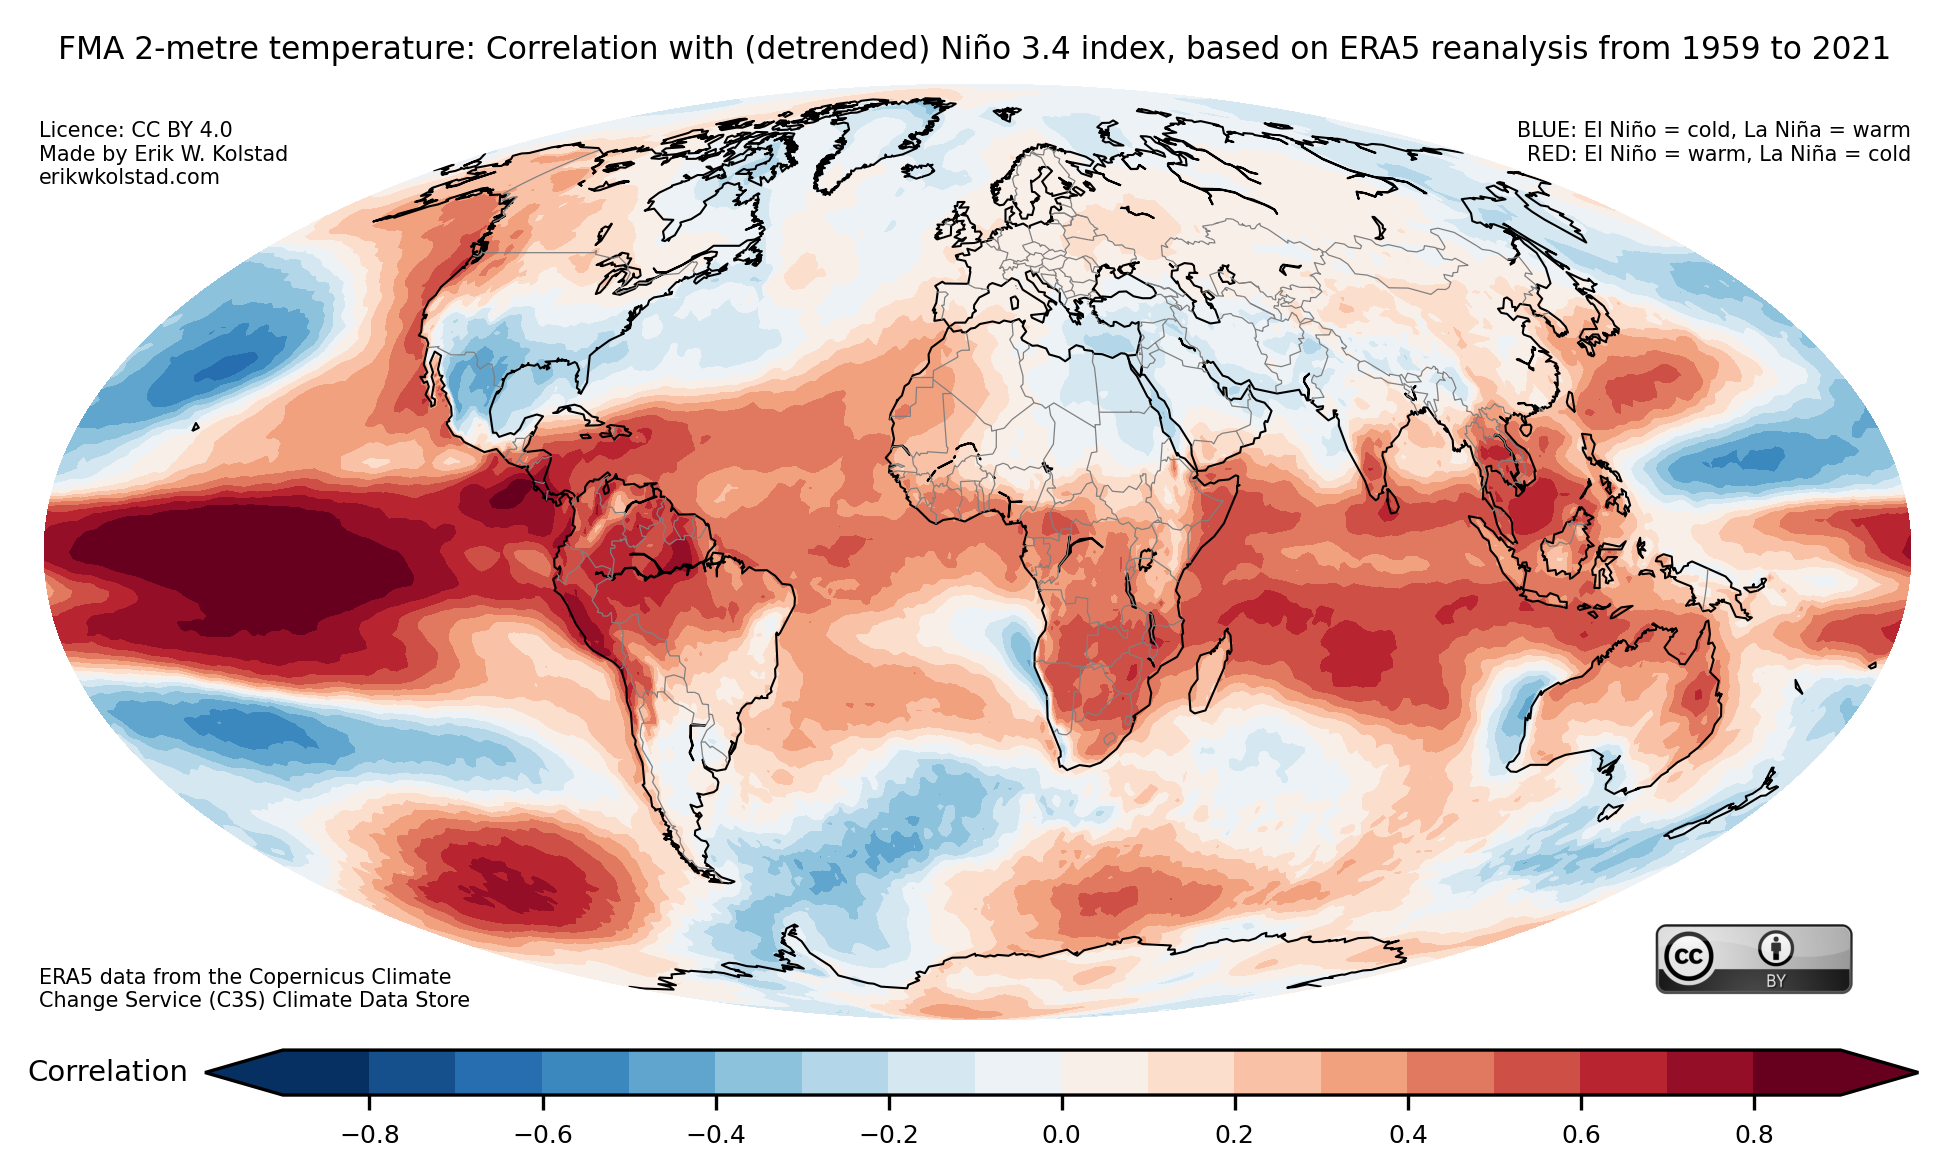
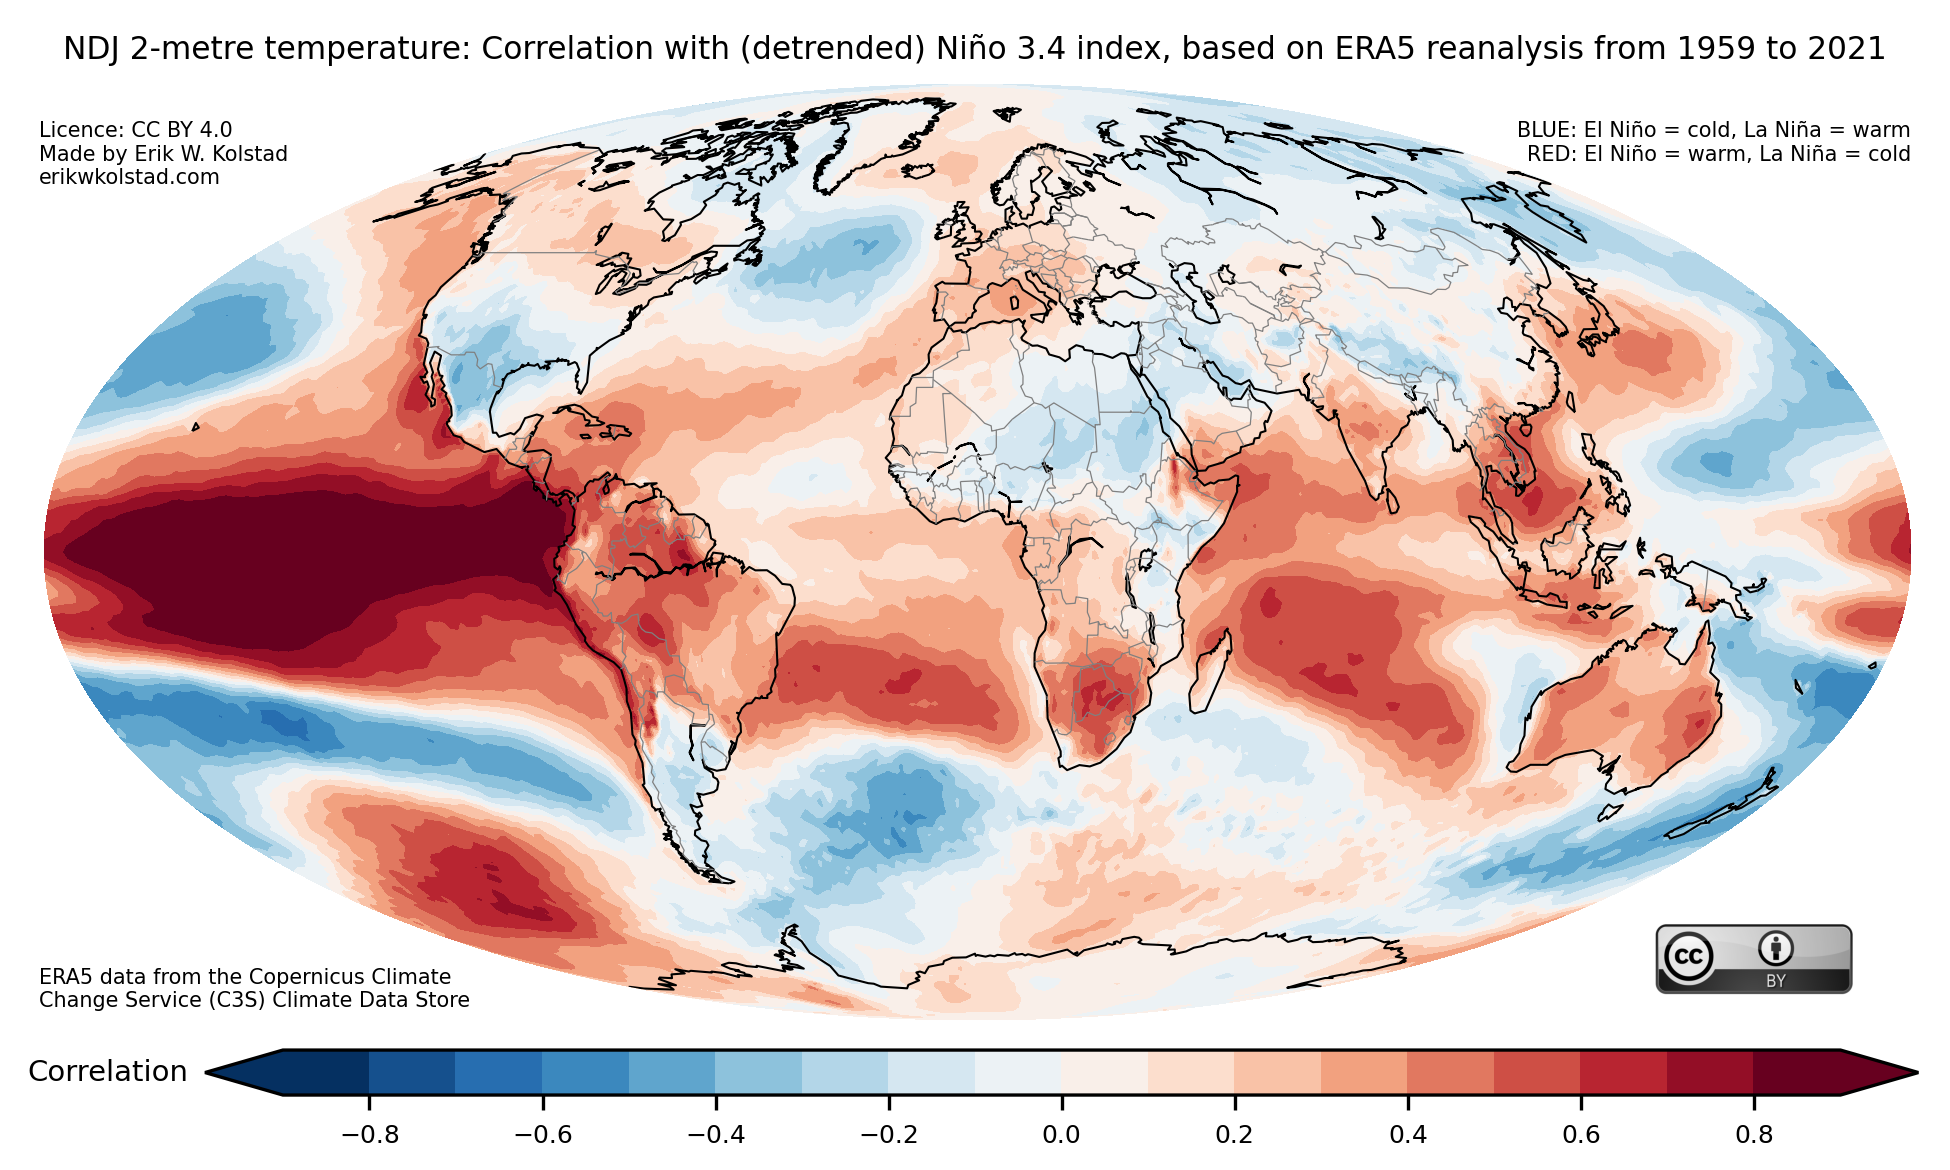
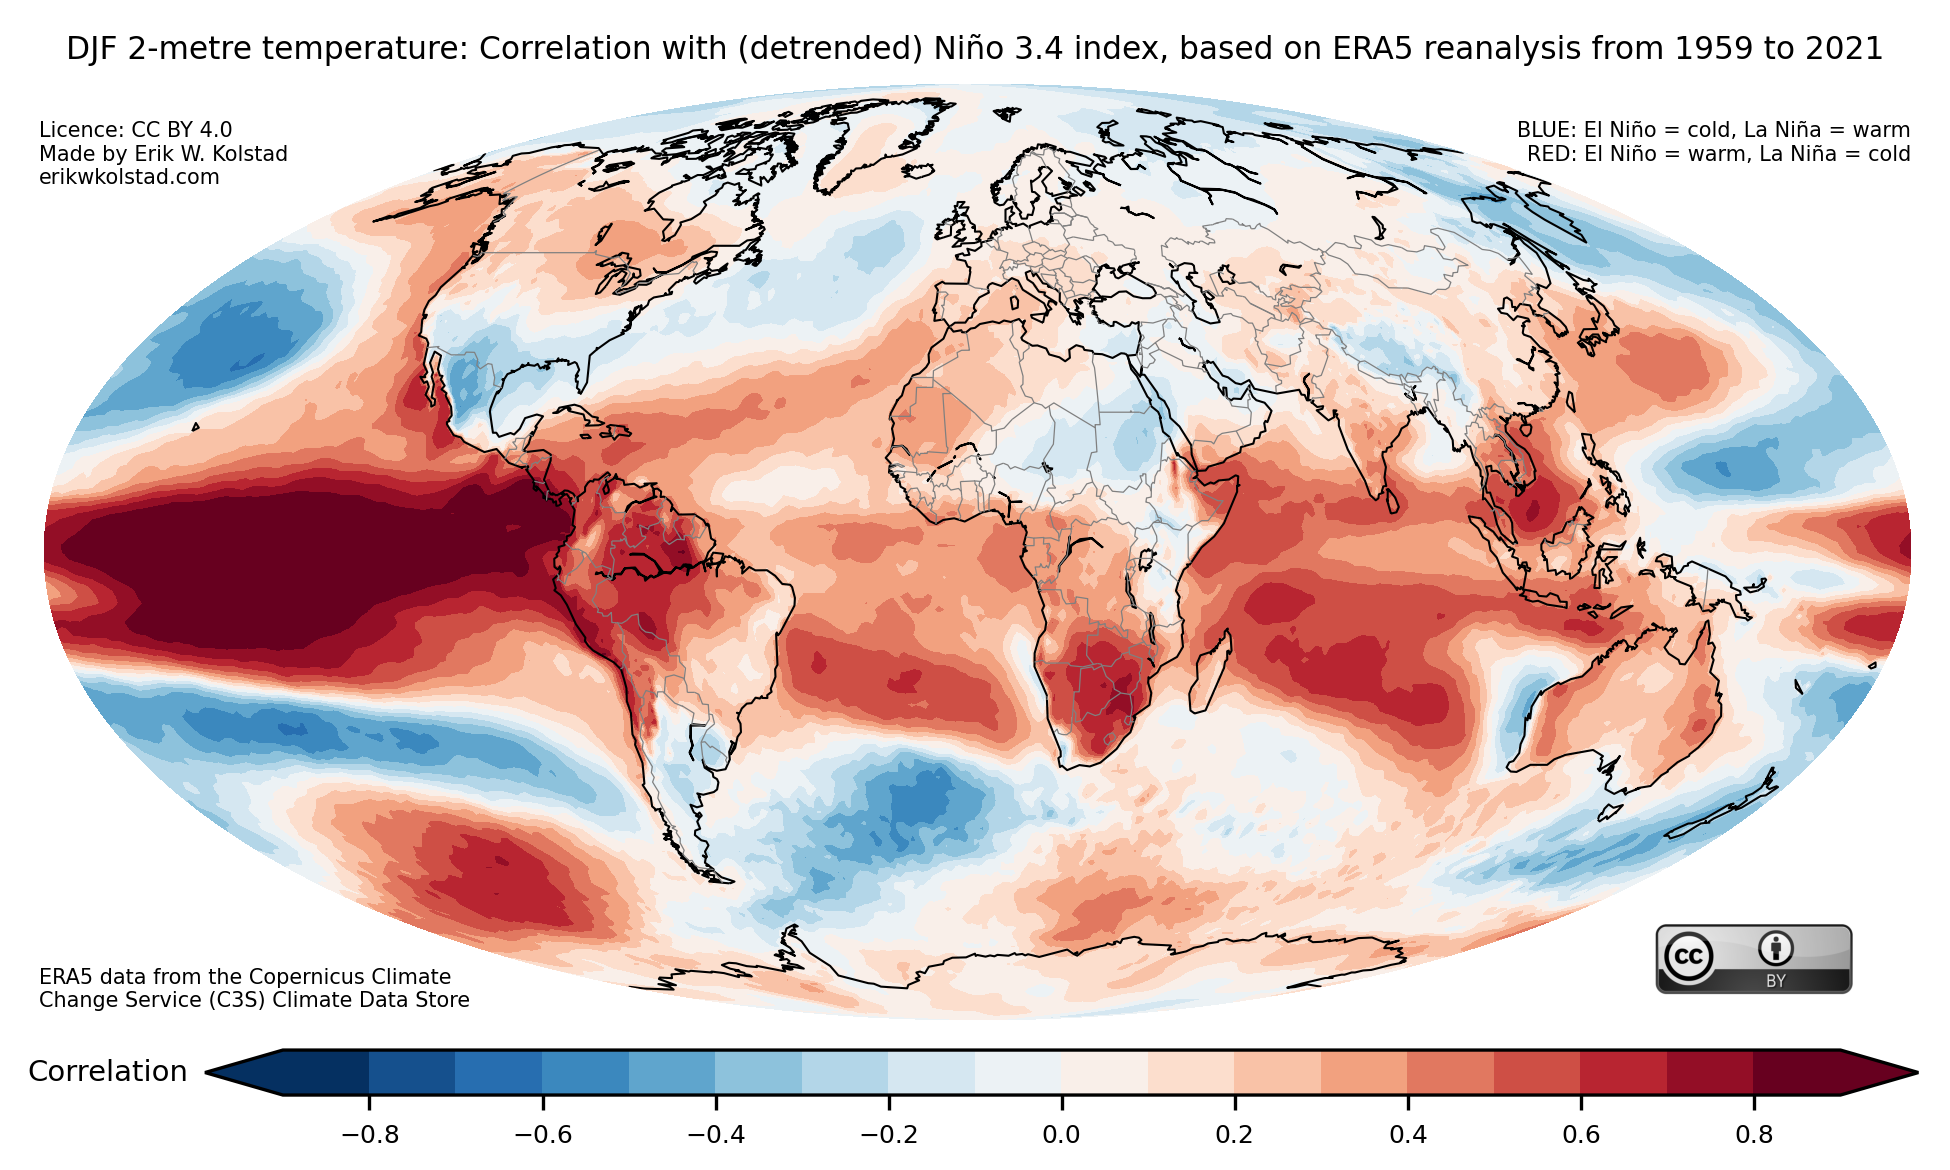
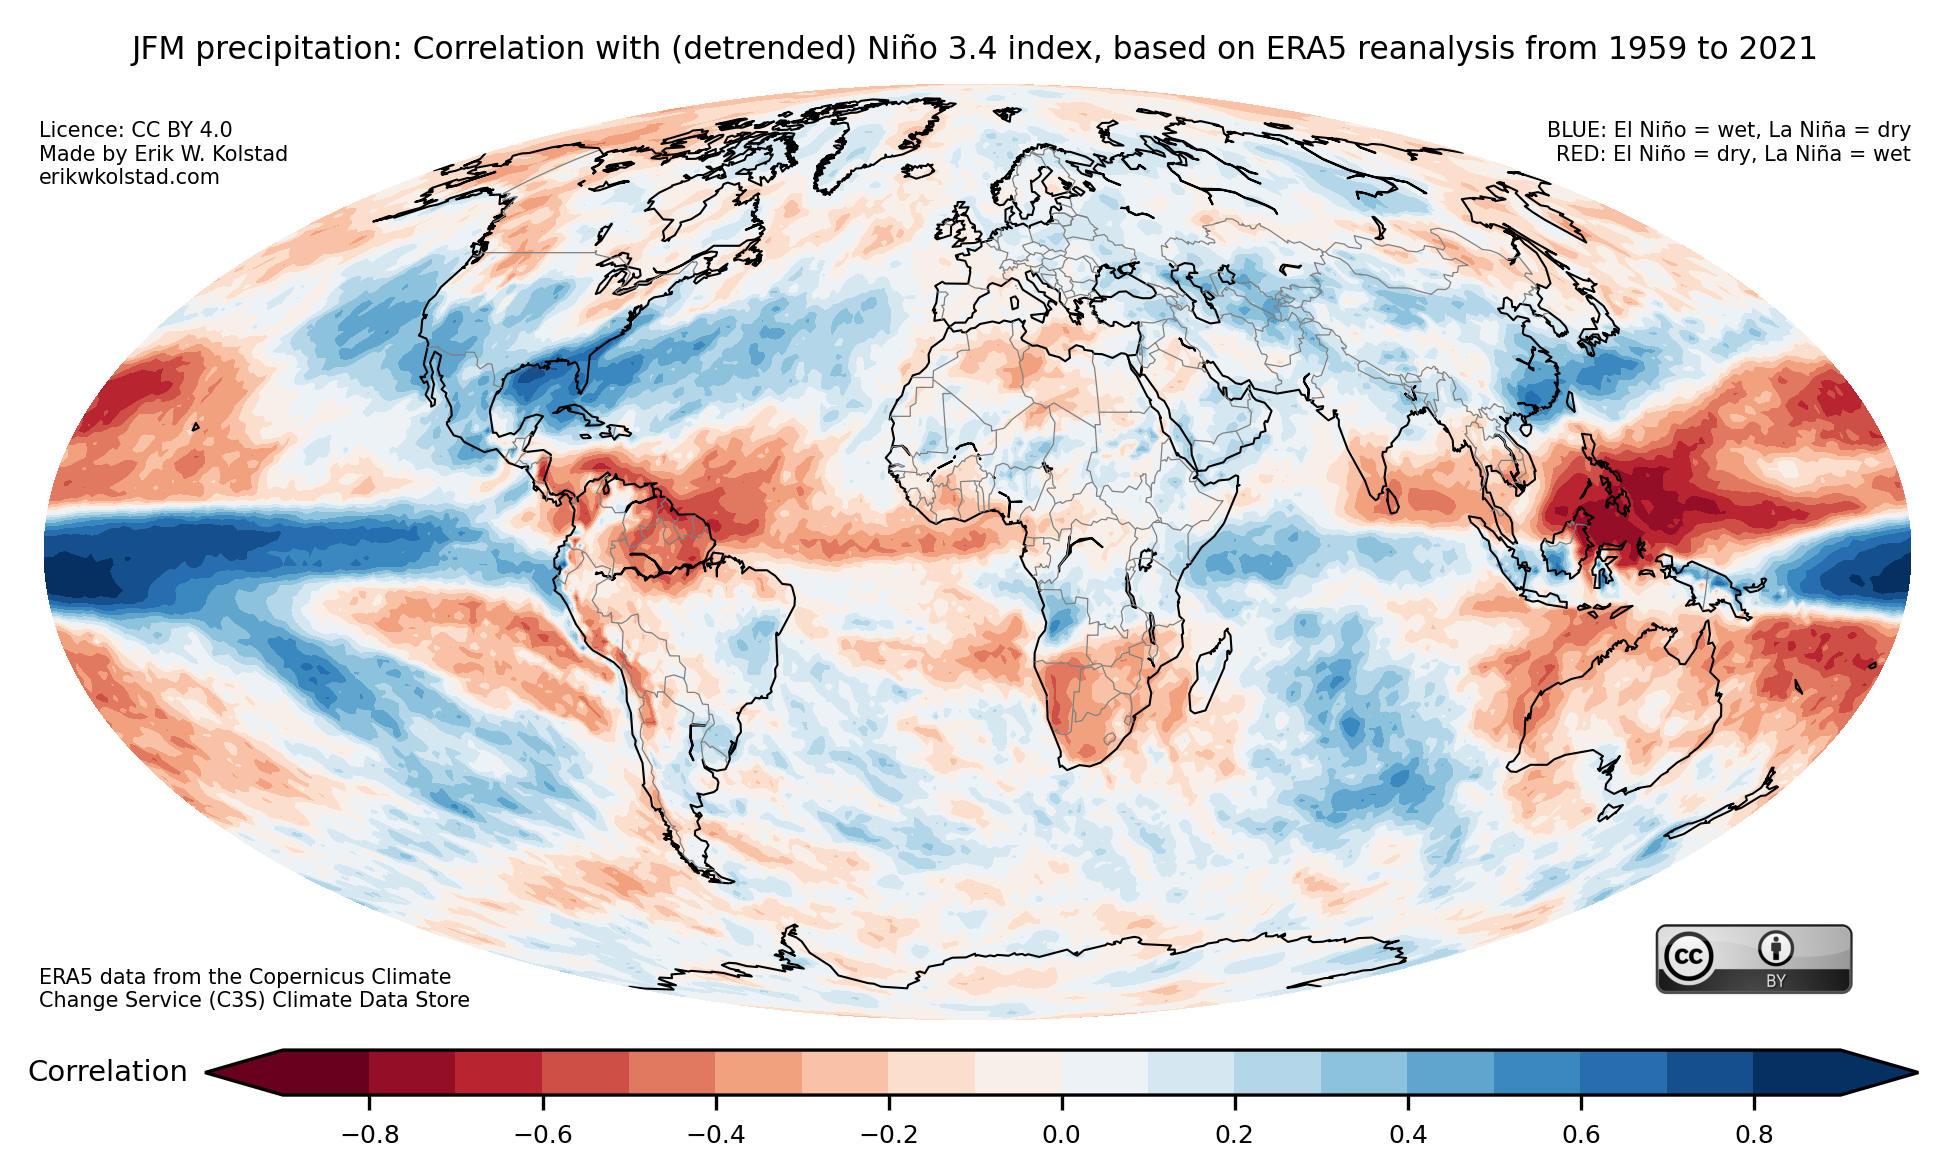
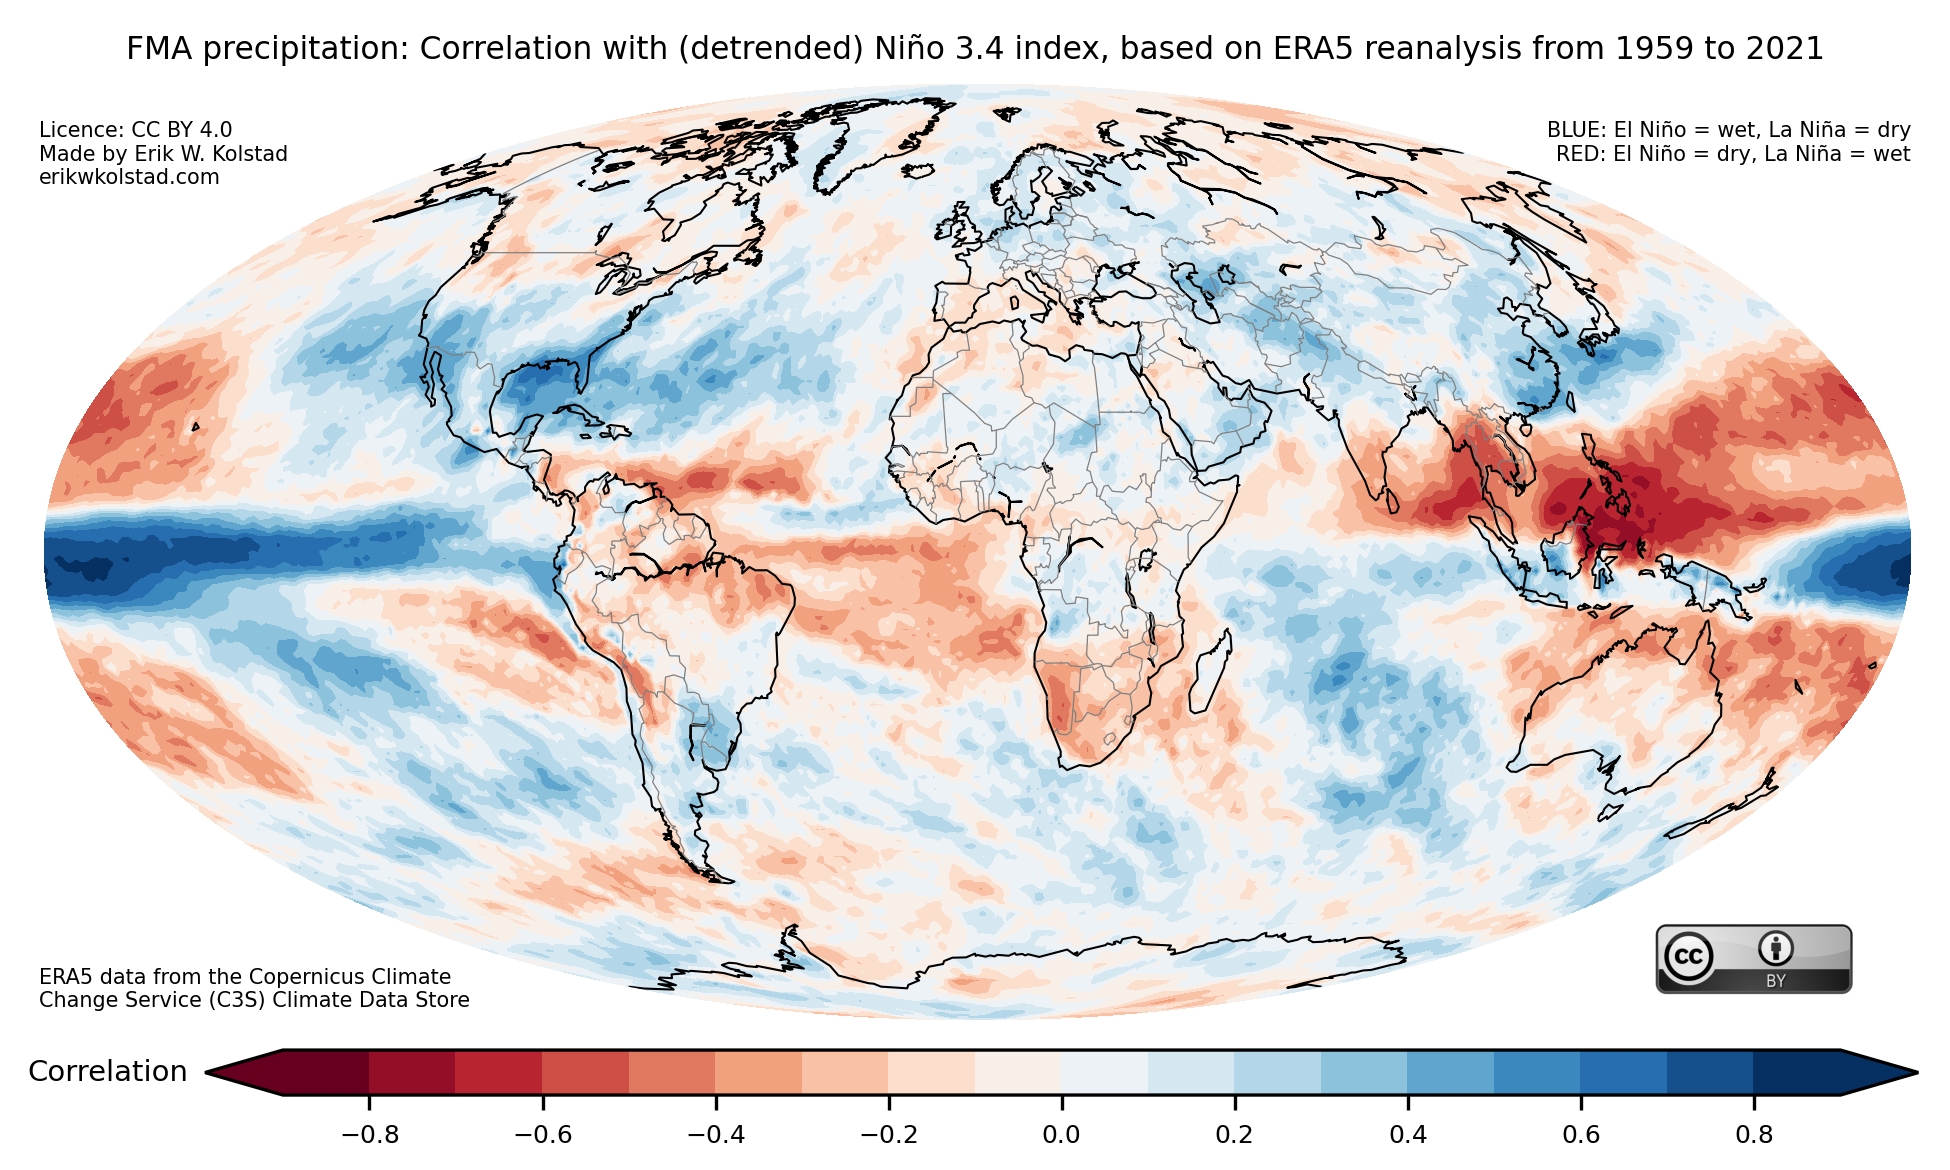
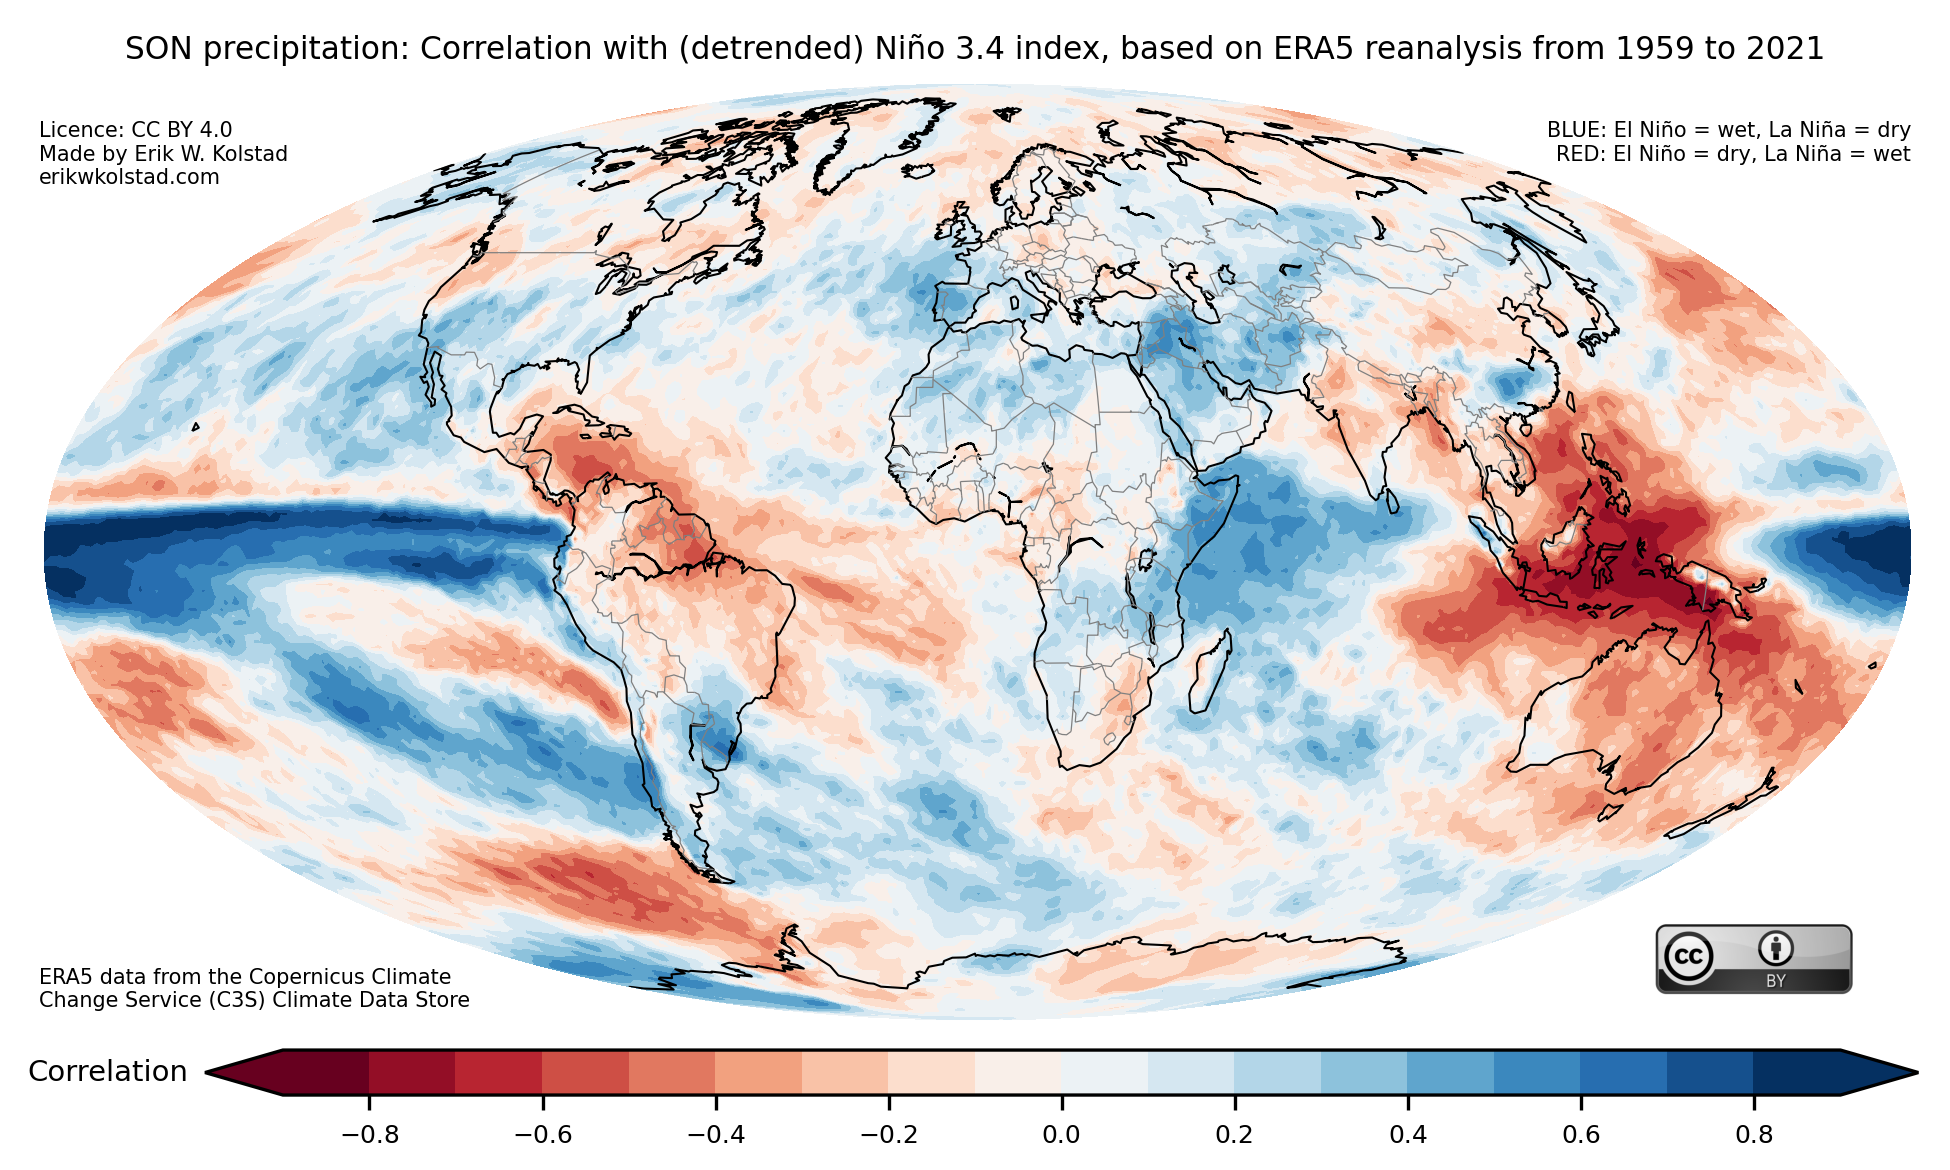
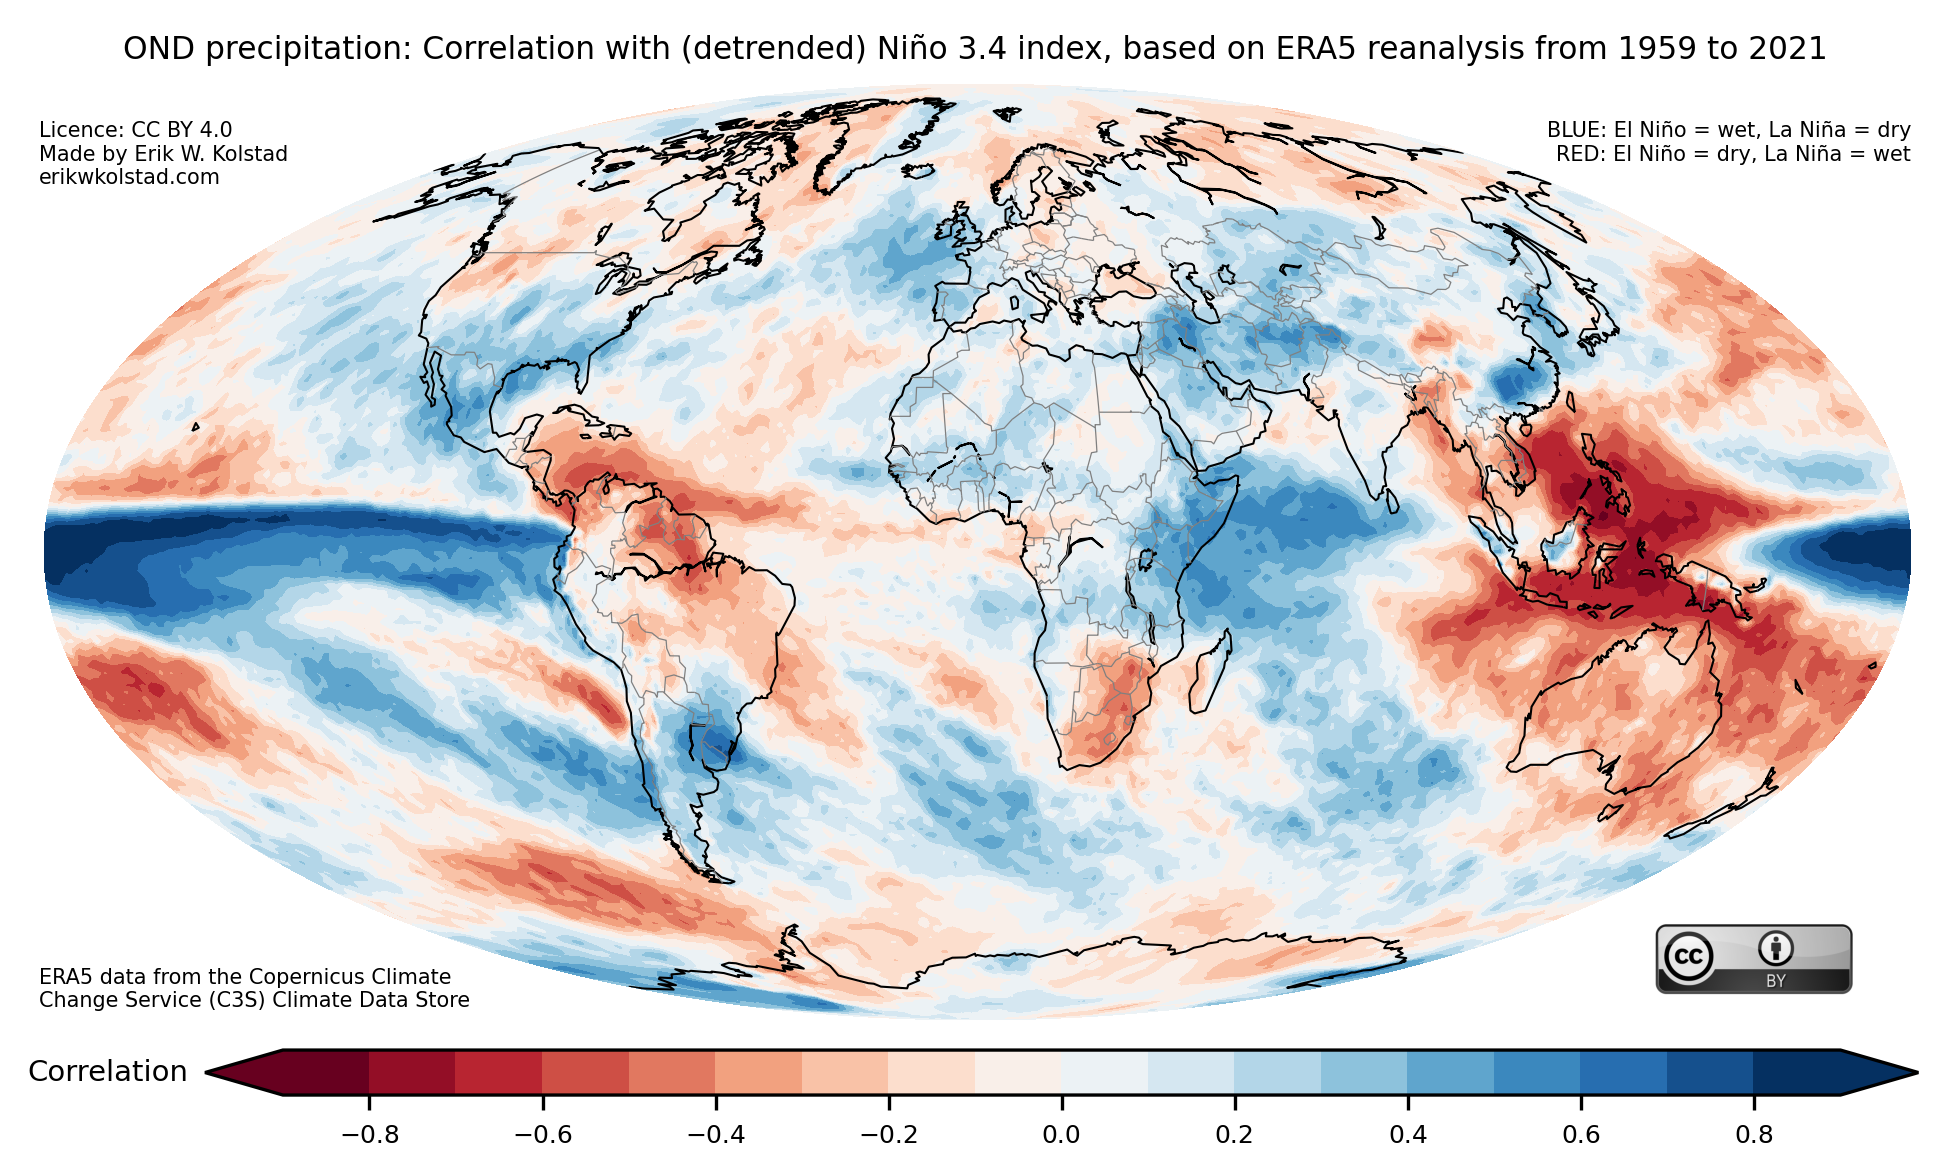
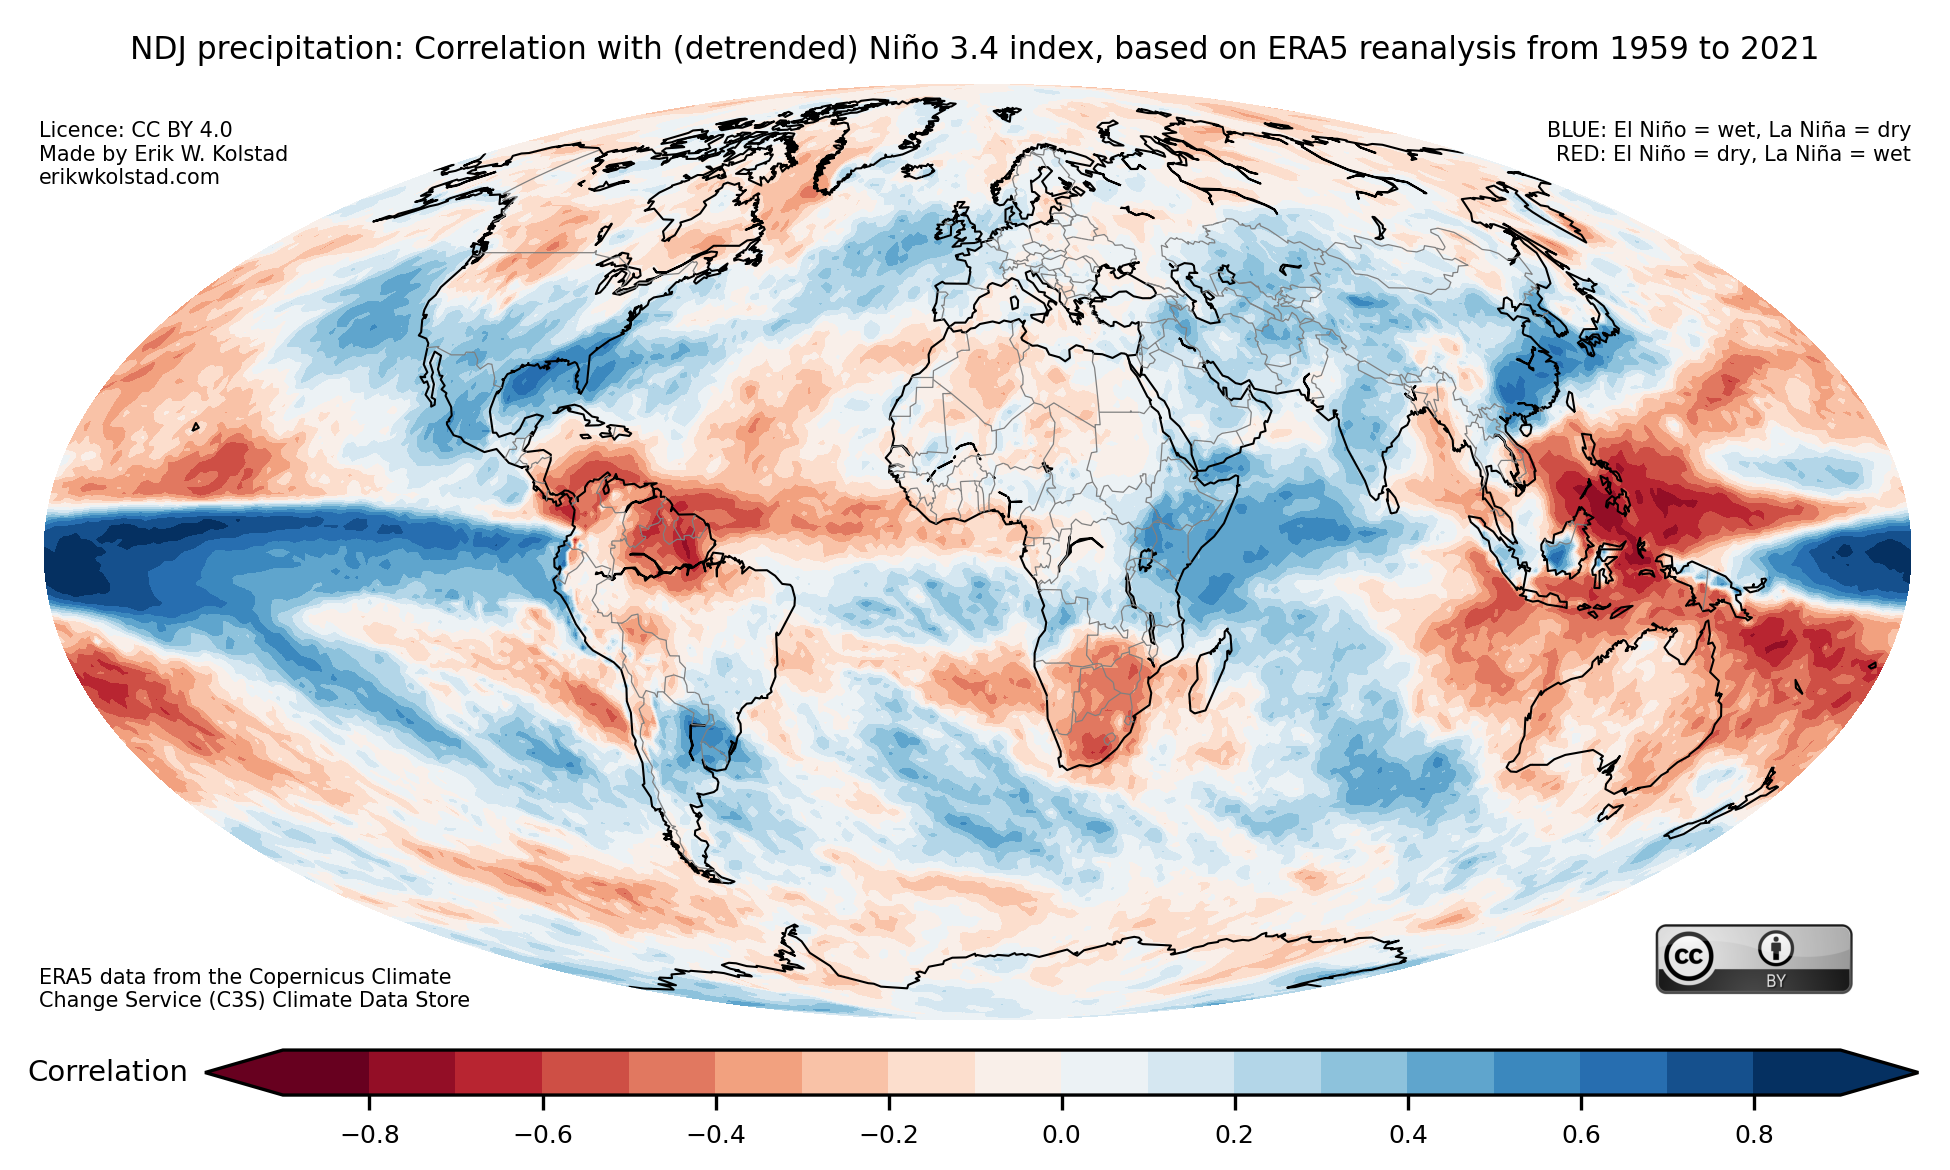
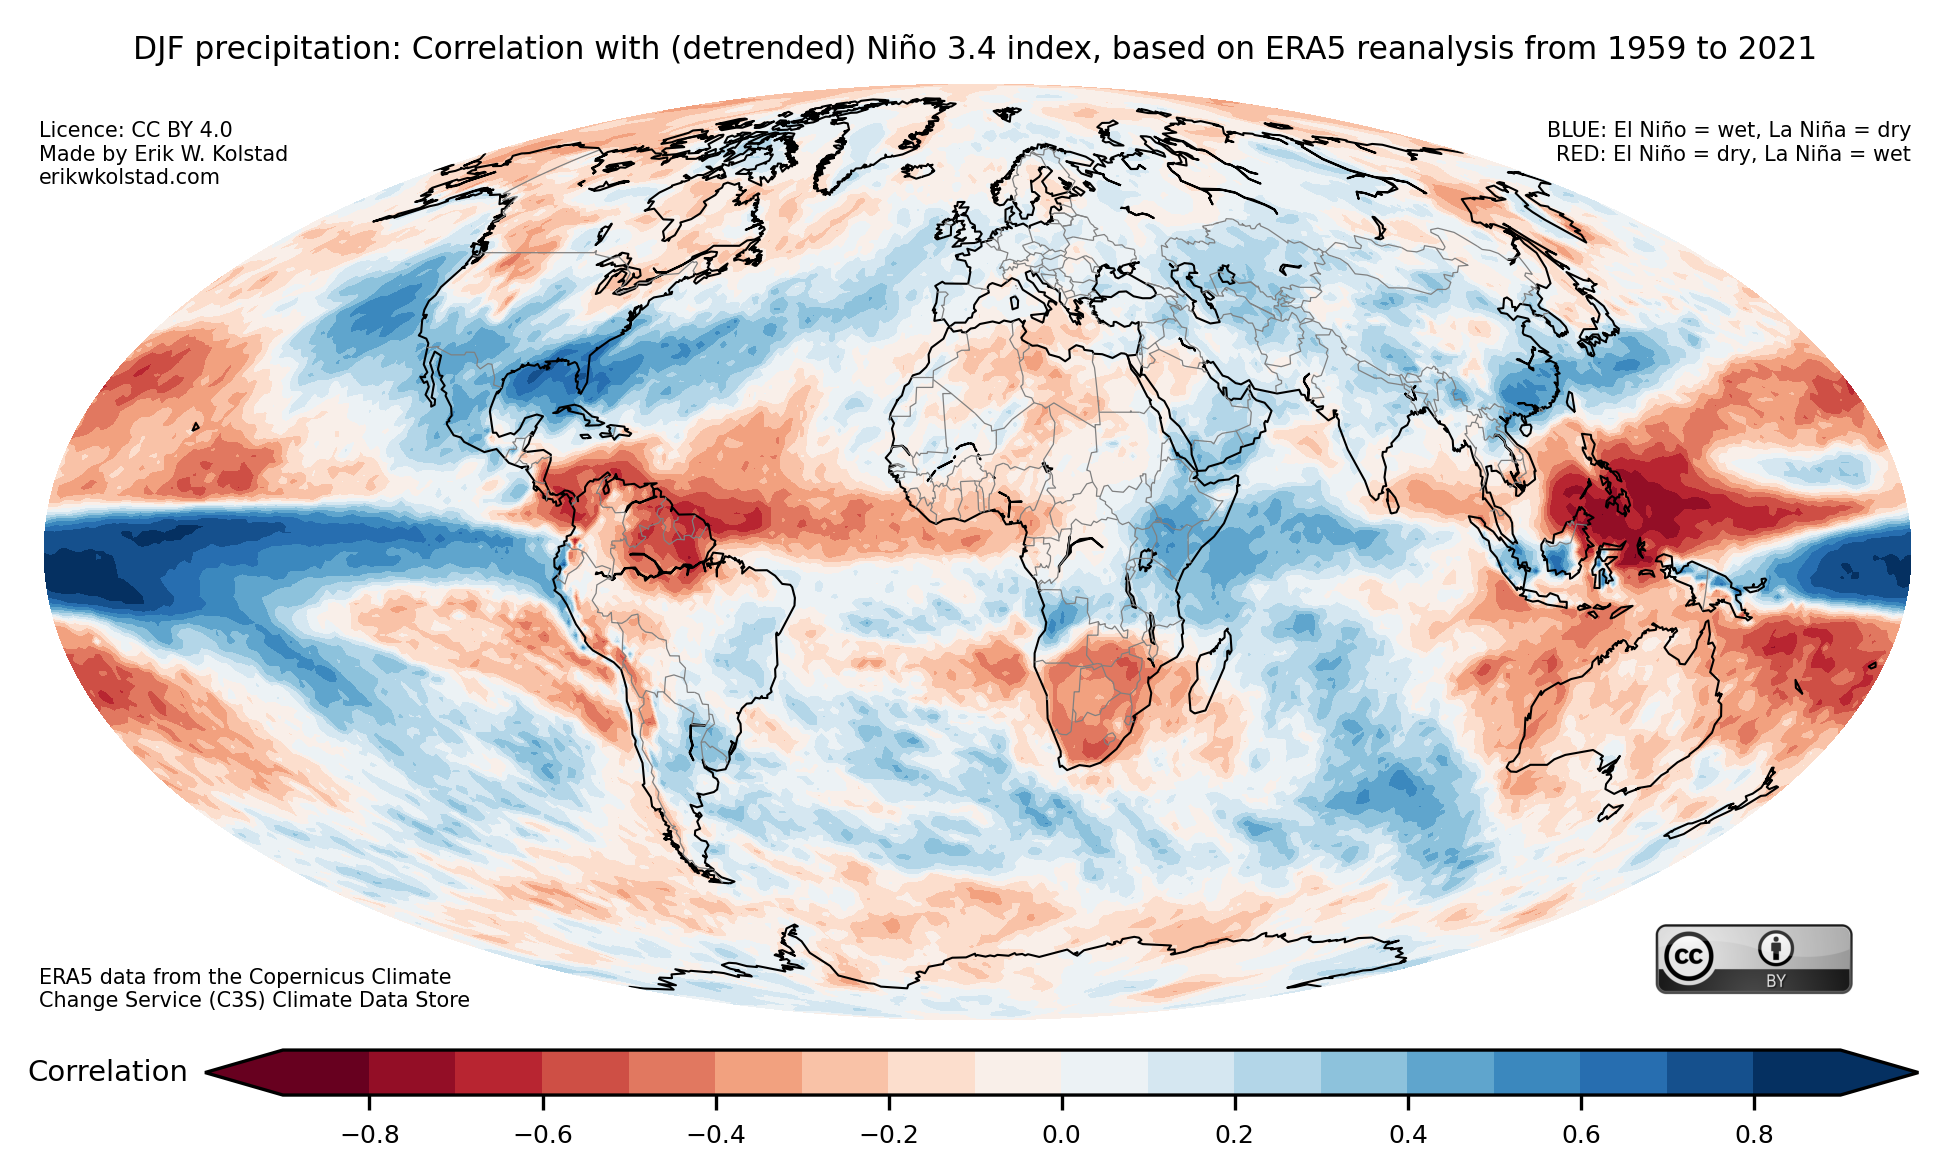
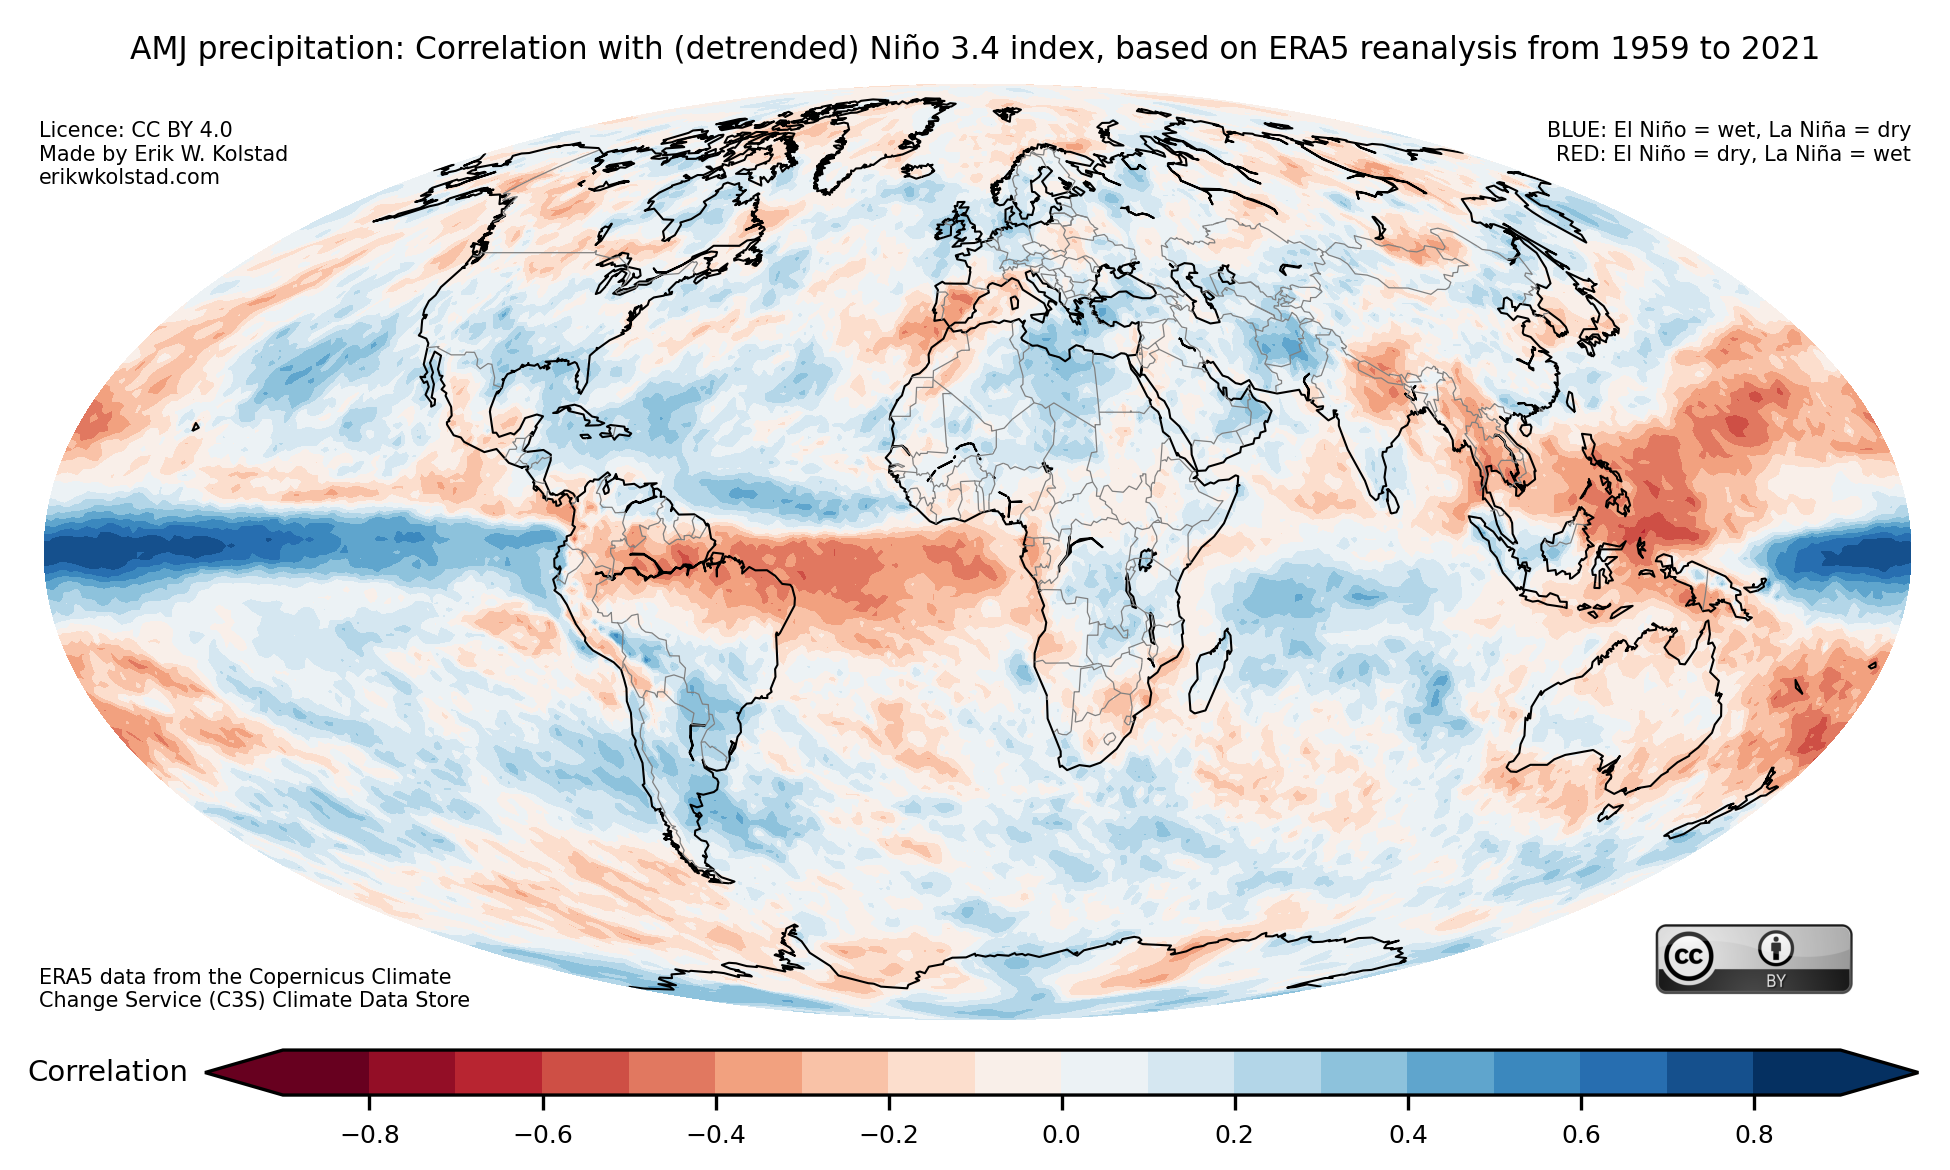
Here is a collection of maps that show the correlation between ENSO (El Niño–Southern Oscillation) and global temperature and precipitation for each possible three-month period, starting with JFM (January–March) and ending with DJF (December–February). The index that I used to represent ENSO (the Niño 3.4 index) is positive when there is an El Niño and negative during La Niña episodes.

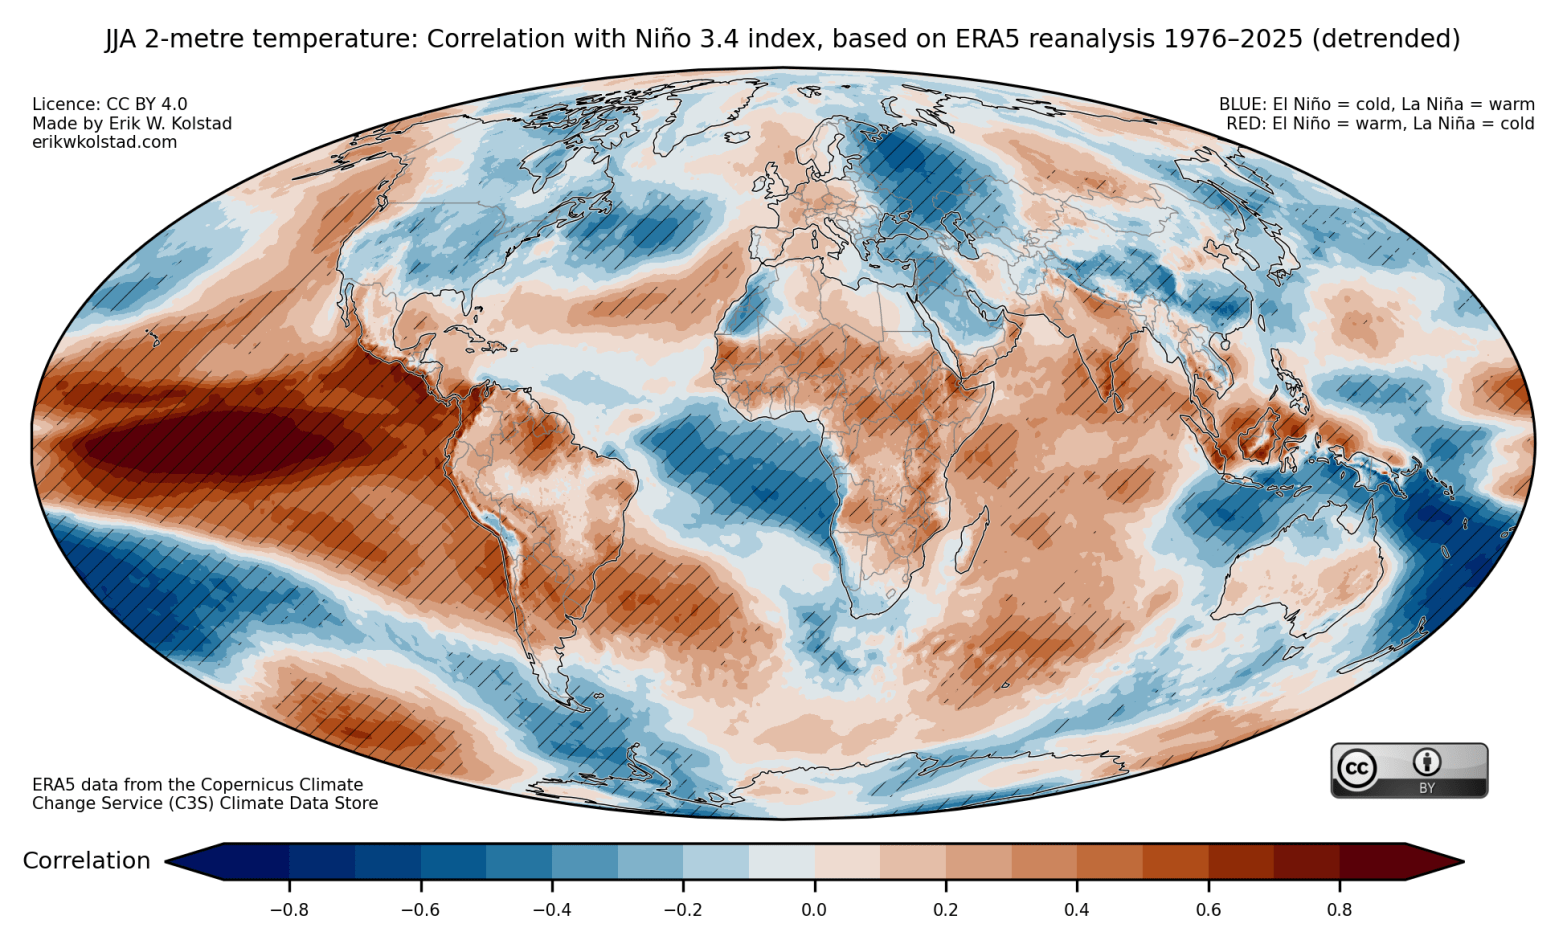
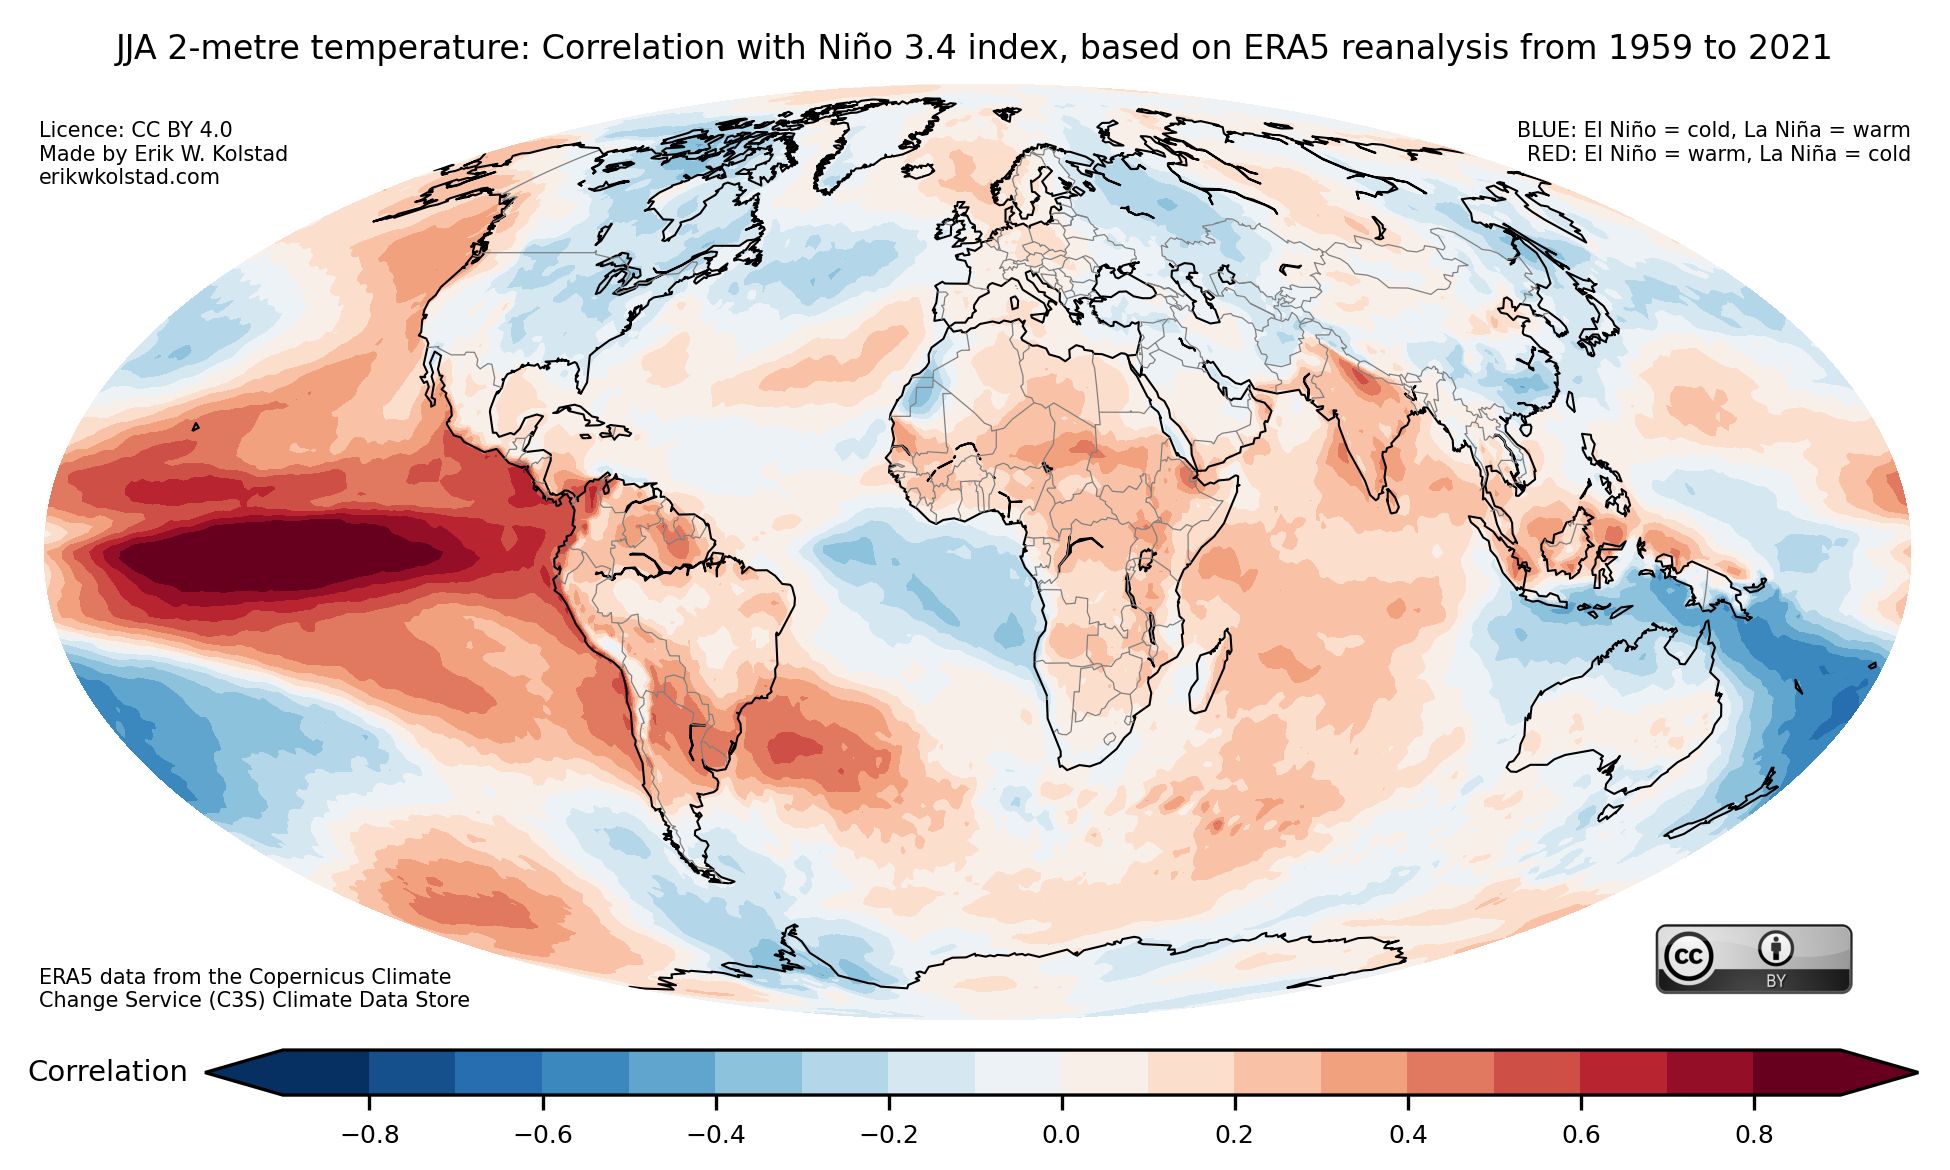
Let’s look at one example first, the boreal summer from June to August (abbreviated JJA). Here’s the map that shows the correlation with temperature:

Correlation between the Niño 3.4 index and temperature during June–August (JJA), using ERA5 reanalysis data from 1959 to 2021. The data were not detrended. Data downloaded from the Copernicus Climate Change Service (C3S) Climate Data Store, doi: 10.24381/cds.f17050d7

The red areas are warmer than normal when there is an active El Niño and colder than normal when during La Niña episodes, where «normal» means the 1959–2021 average. It is no surprise that the eastern part of the Equatorial Pacific is red on the map, as the definition of El Niño is that the ocean surface in this region is warmer than normal. The correlations in Europe are slightly positive, while in the east part of North America they are negative.

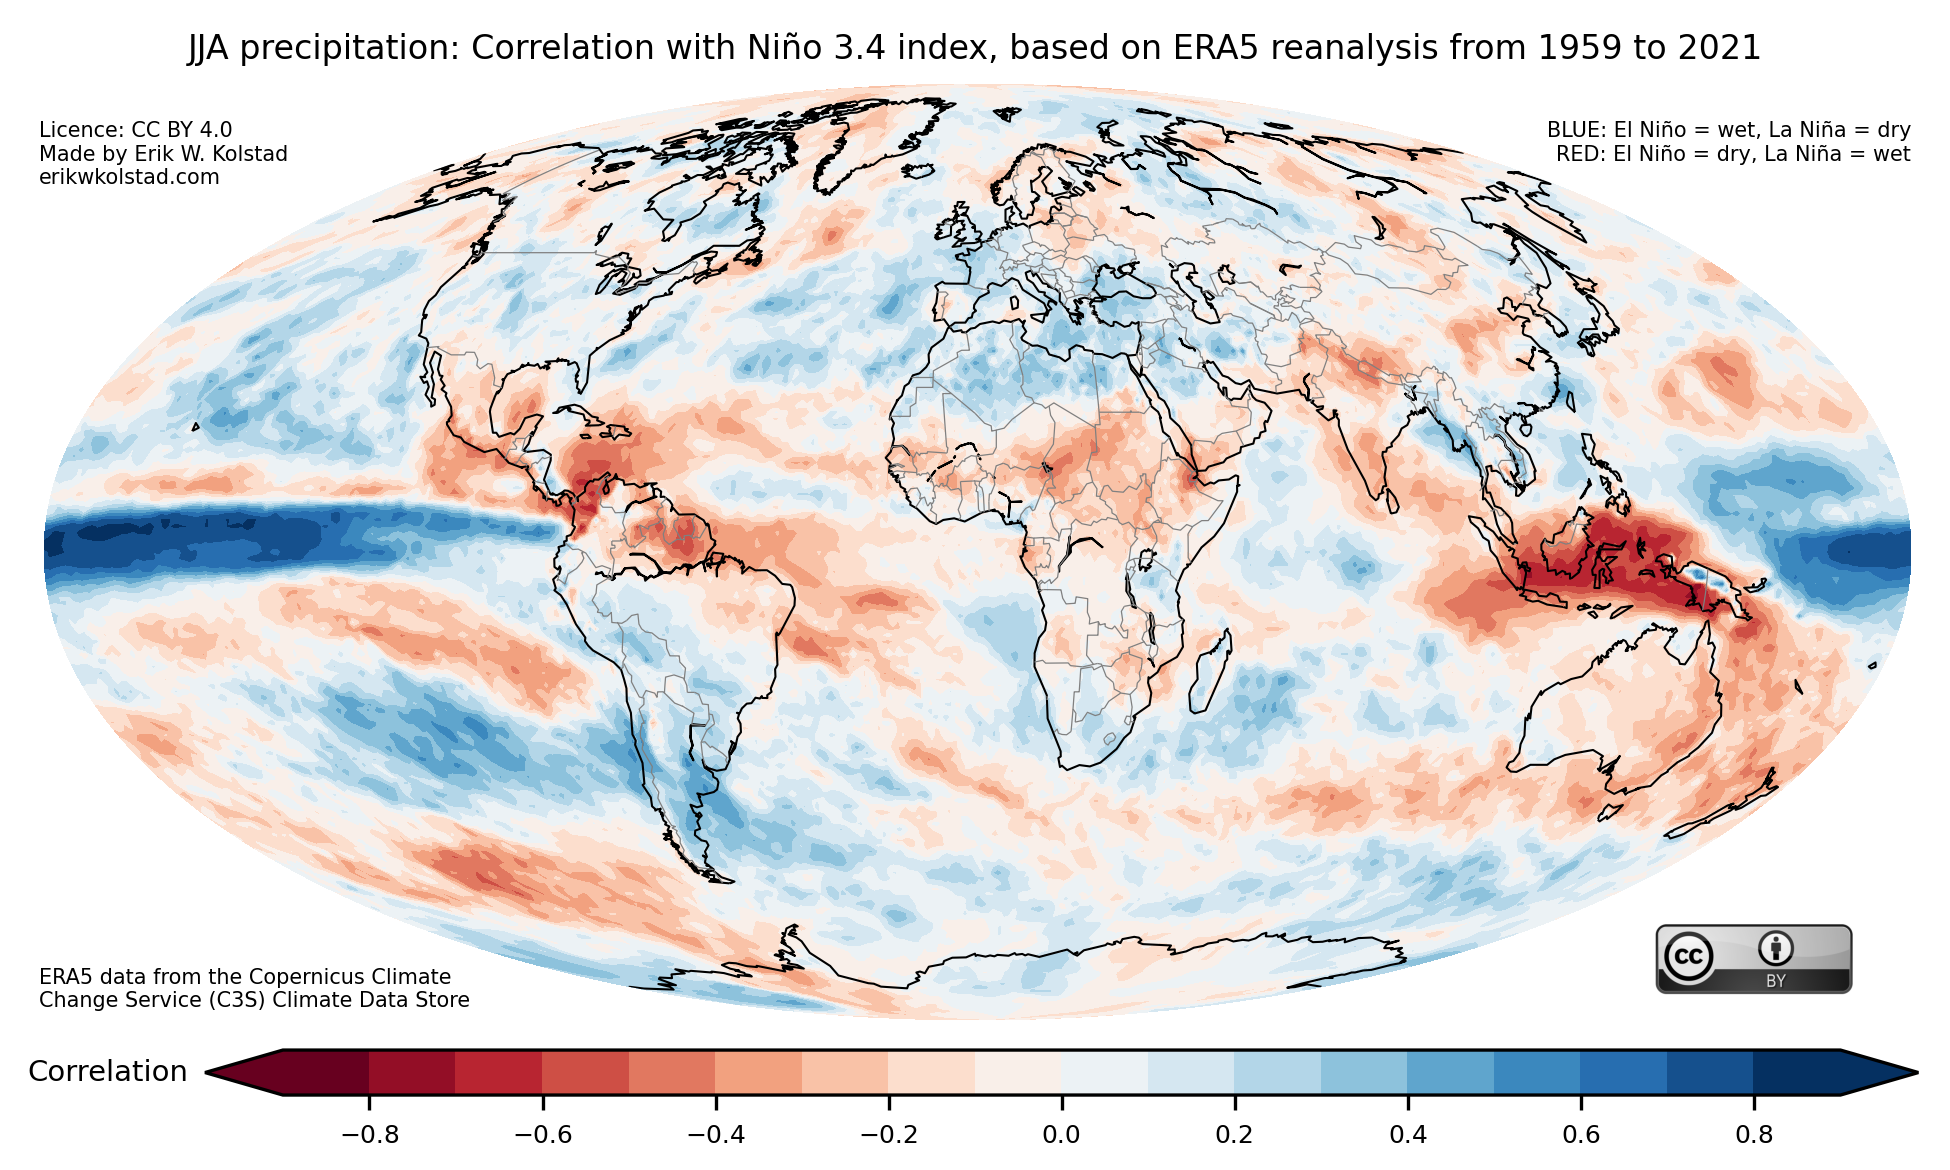
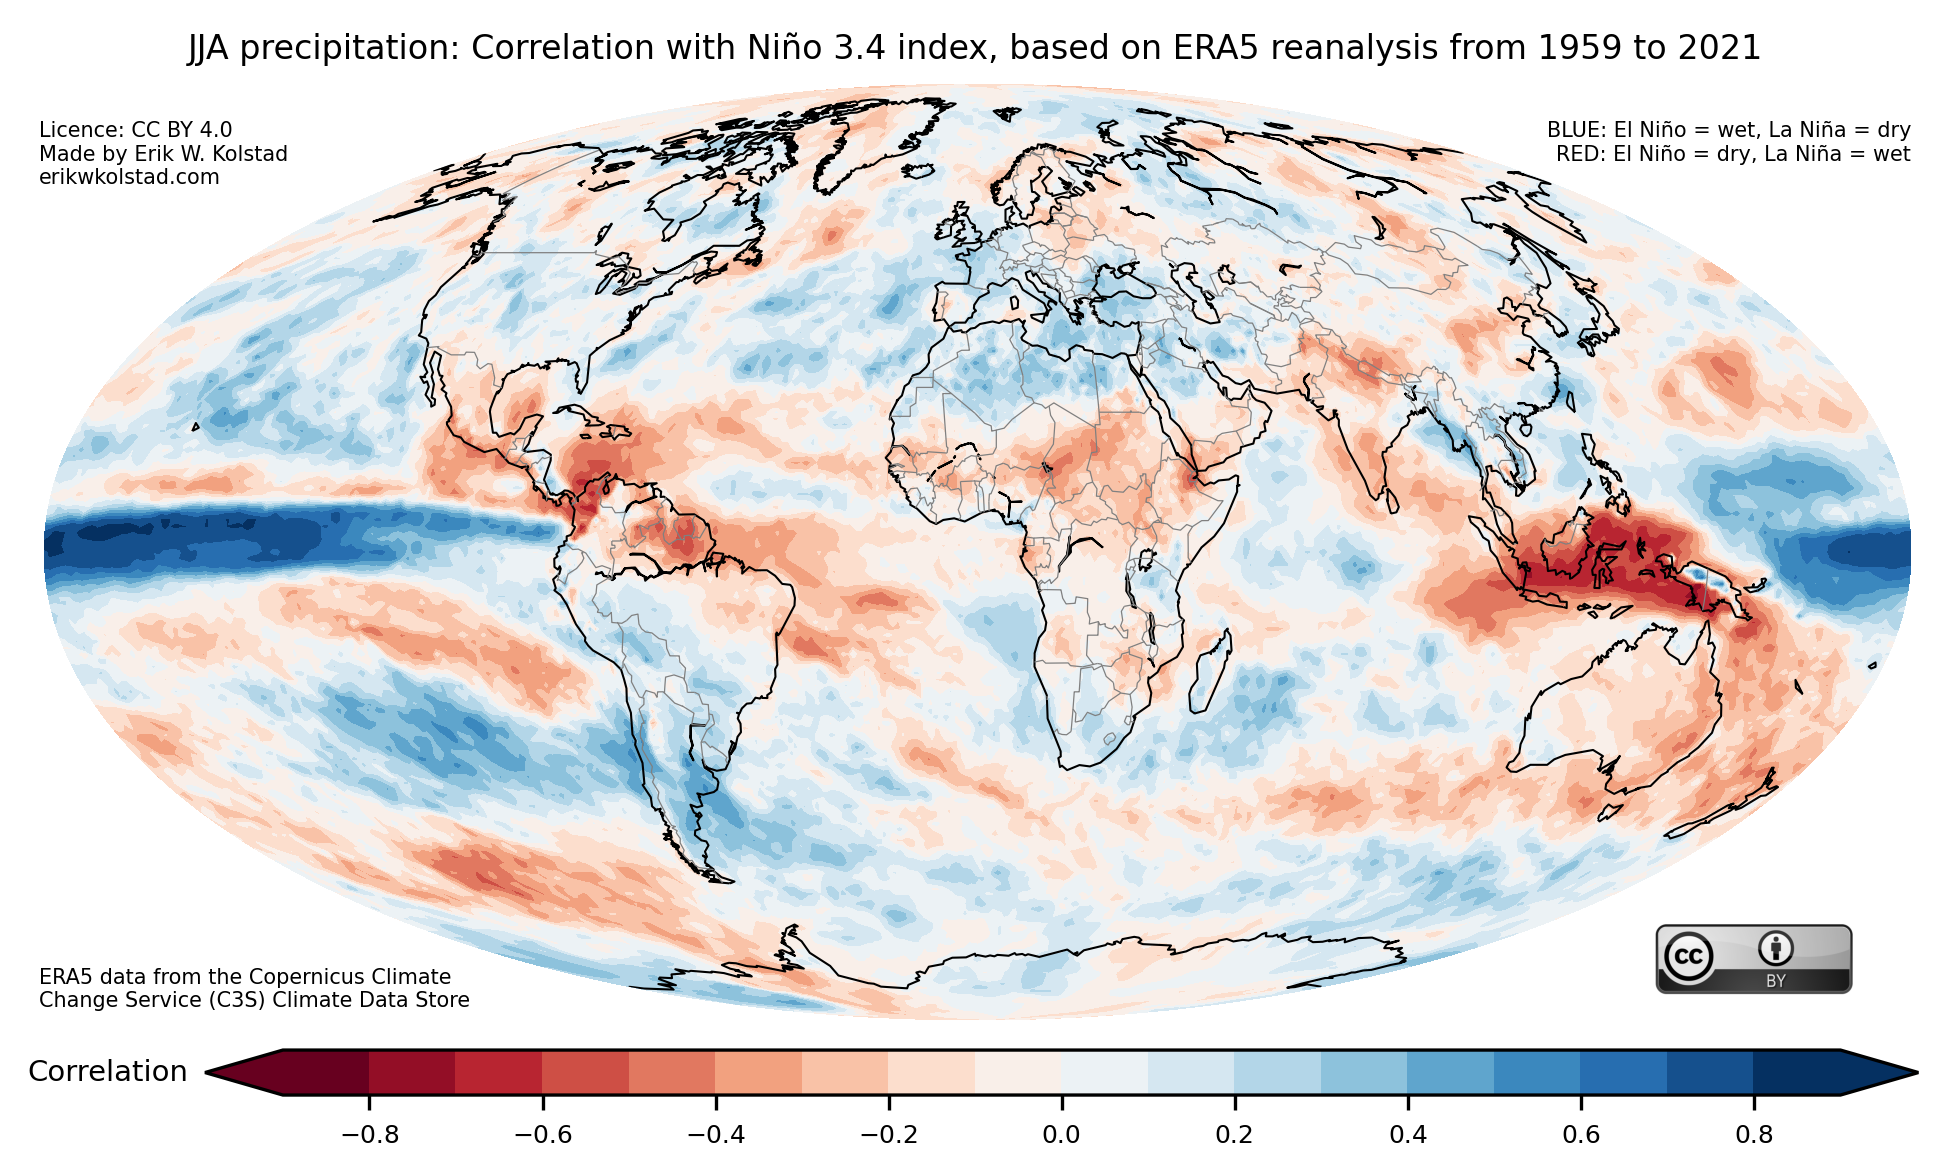
Here’s the corresponding map for precipitation (rainfall):

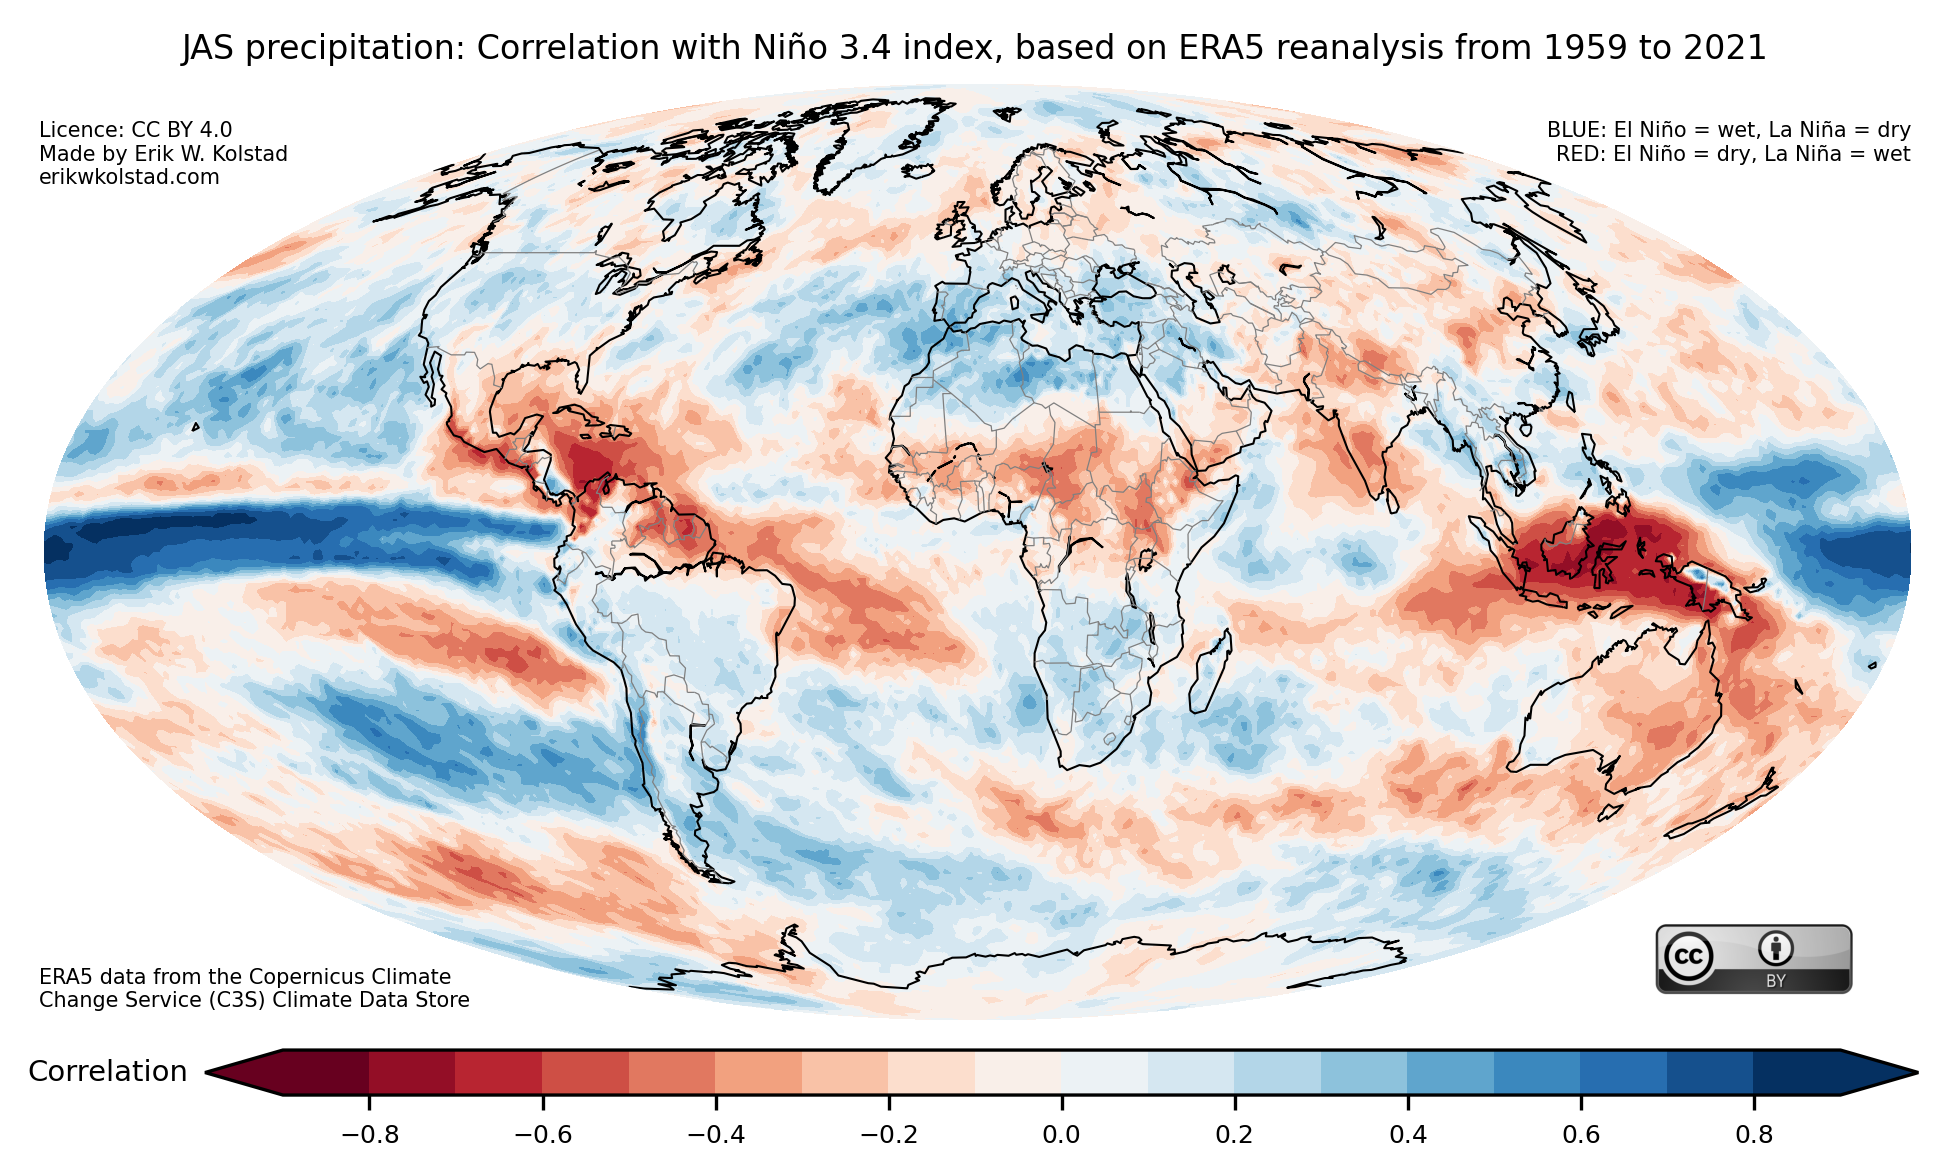
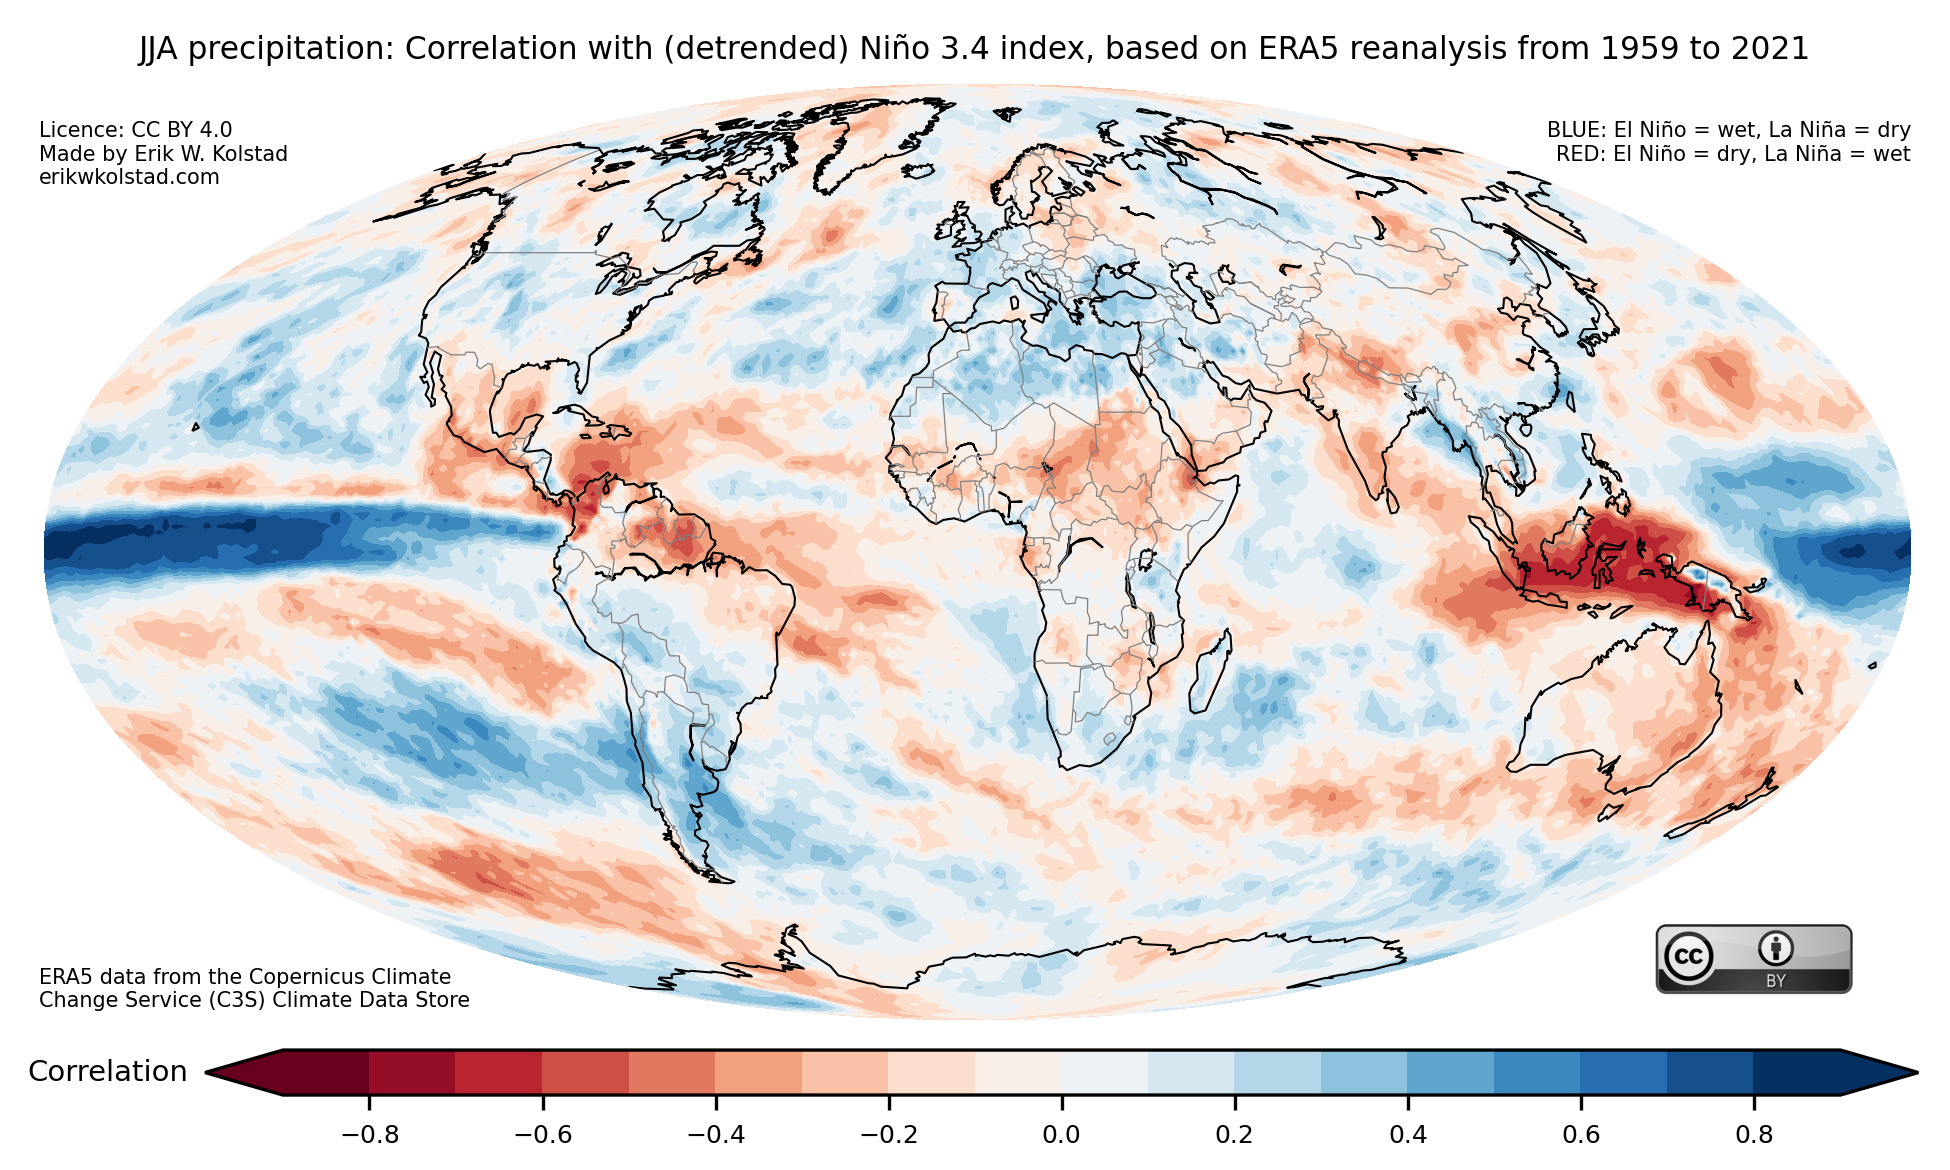
Correlation between the Niño 3.4 index and precipitation during June–August (JJA), using ERA5 reanalysis data from 1959 to 2021. The data were not detrended. Data downloaded from the Copernicus Climate Change Service (C3S) Climate Data Store, doi: 10.24381/cds.f17050d7

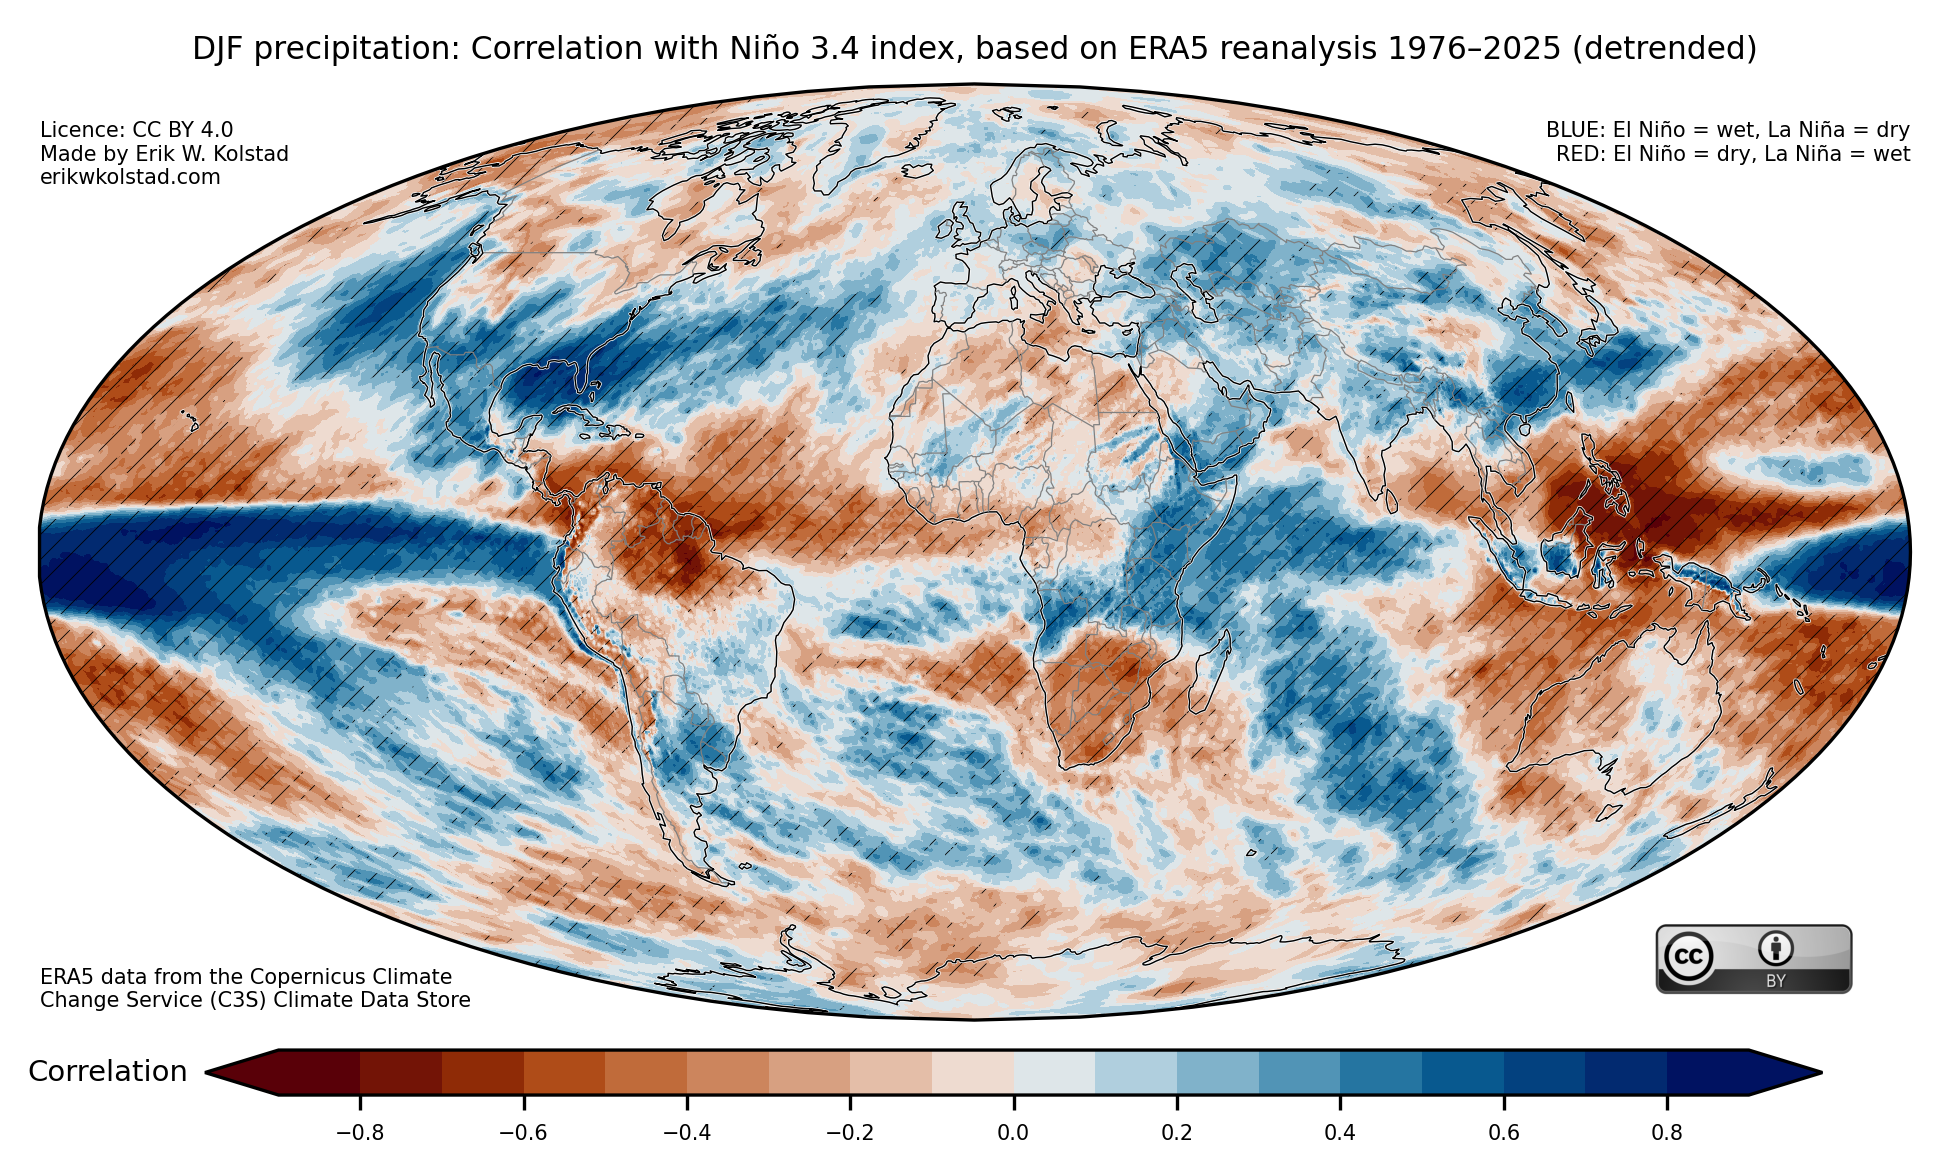
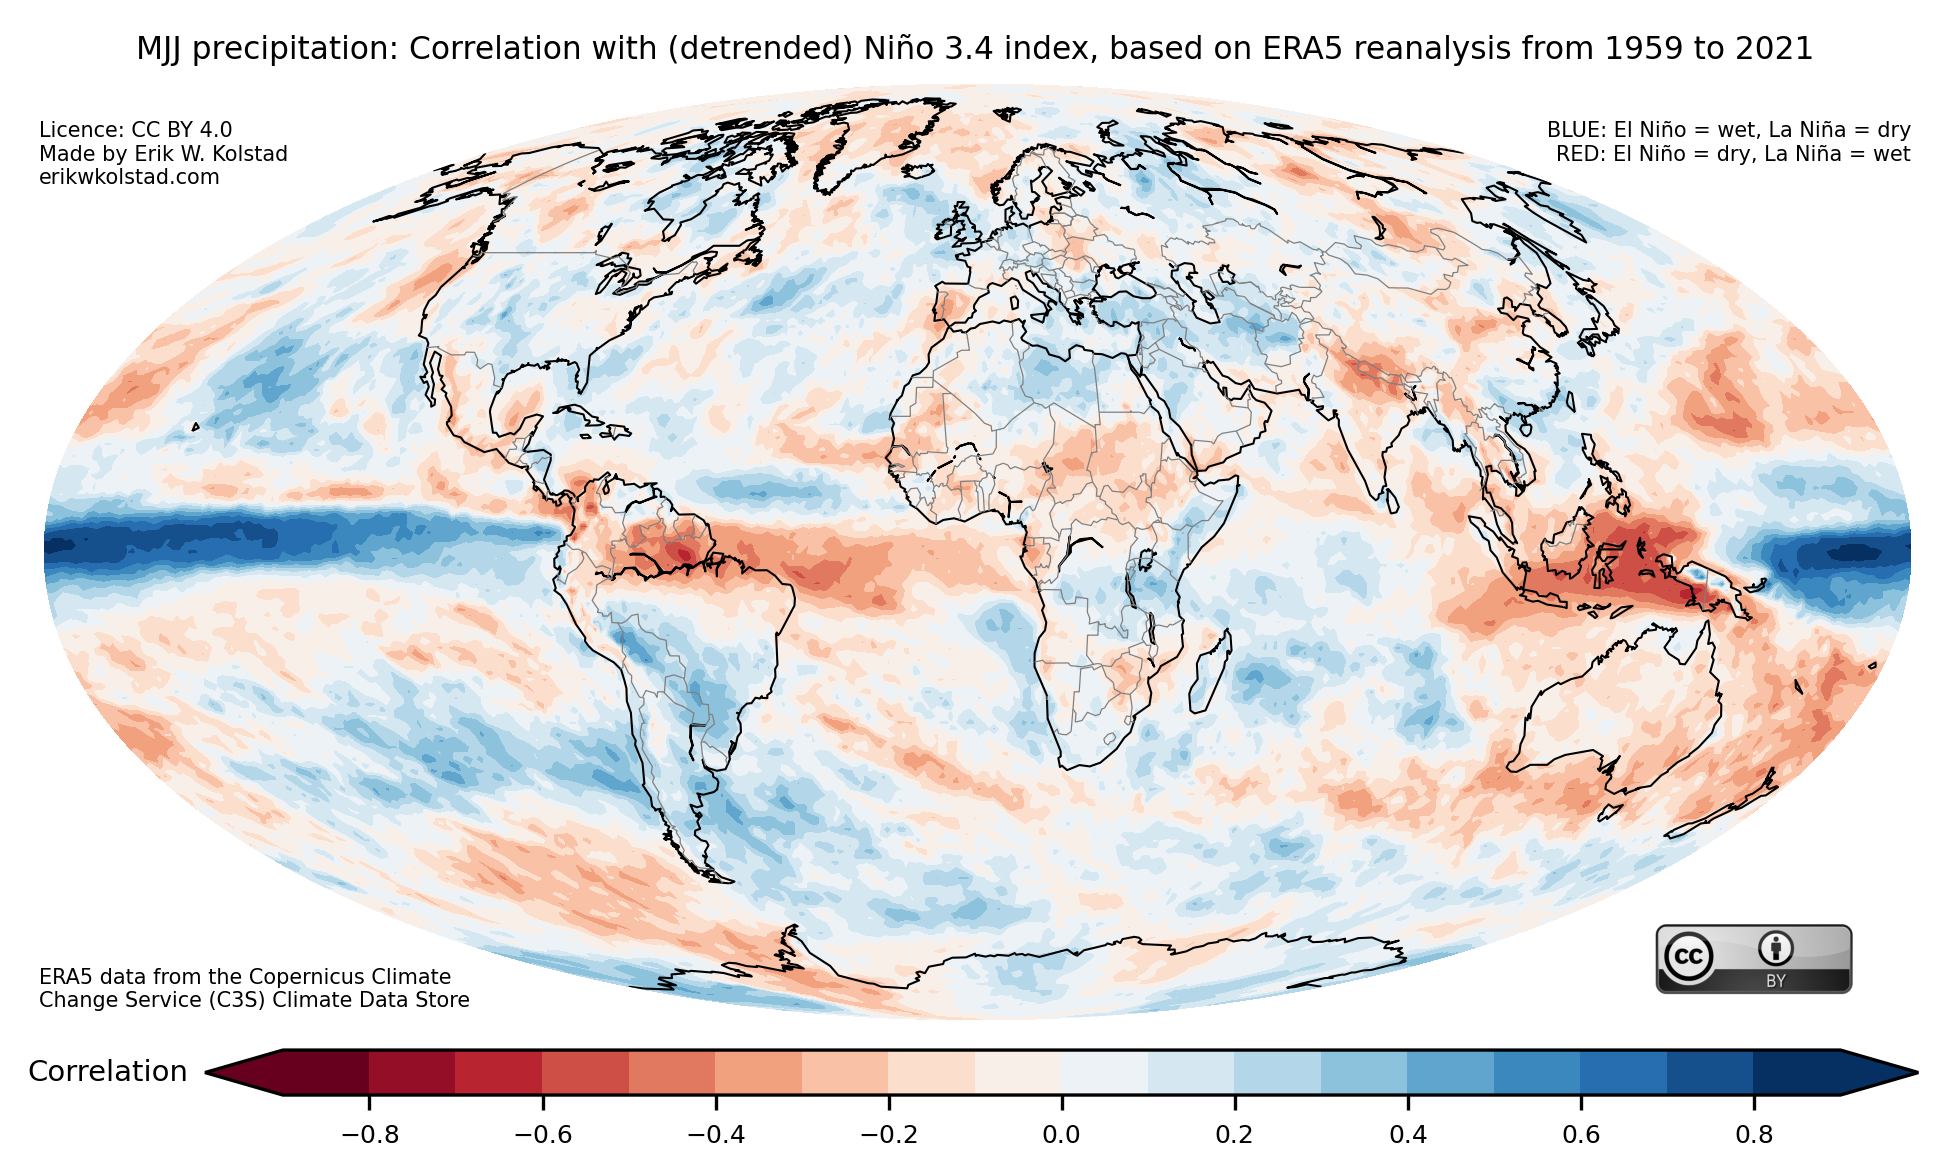
Some areas stand out as drier-than-normal during El Niños, such as Central America and the northern part of North America, Australia, Indonesia, and Equatorial Africa, and other areas are usually wetter-than-normal, including North Africa, CONUS (the contiguous United States), large parts of South America, western Europe, and South Africa.

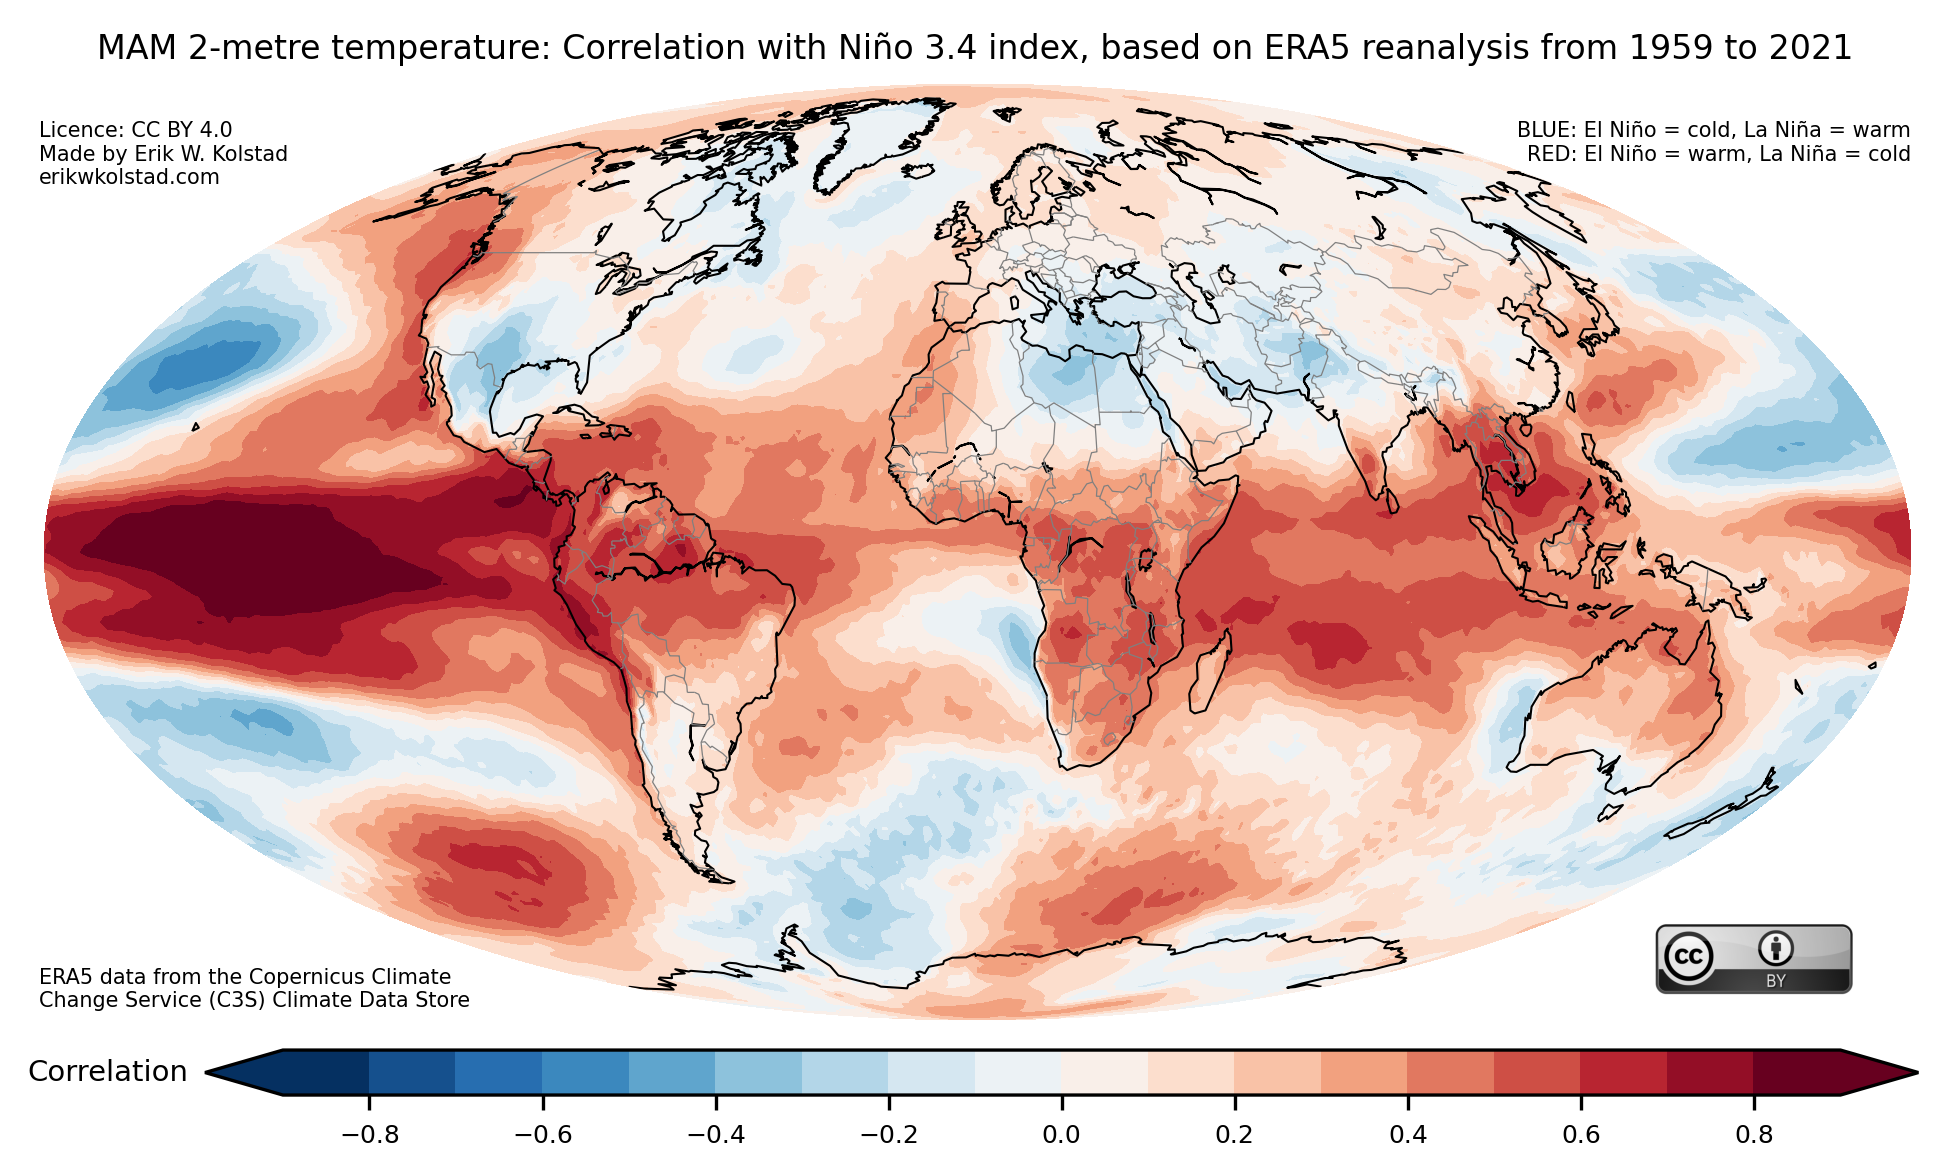
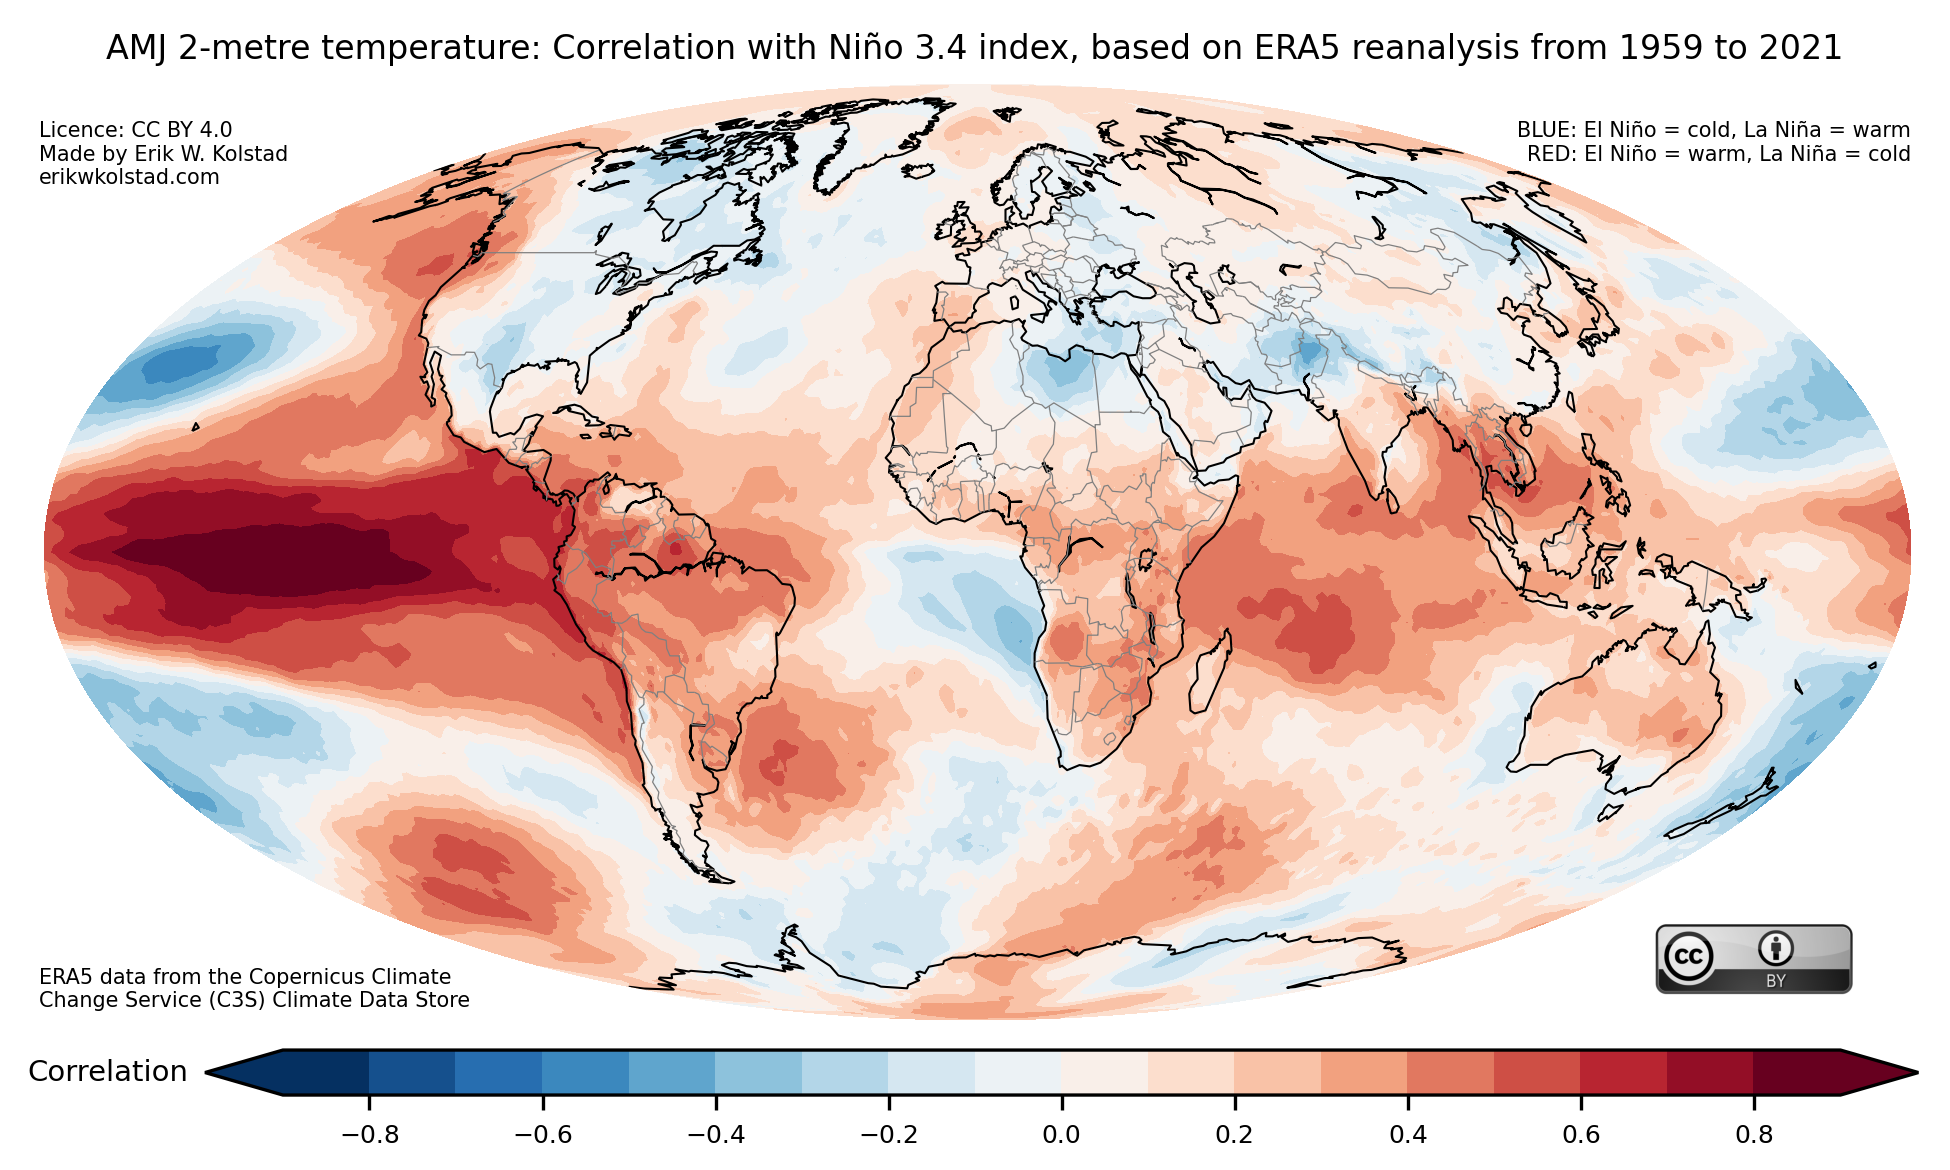
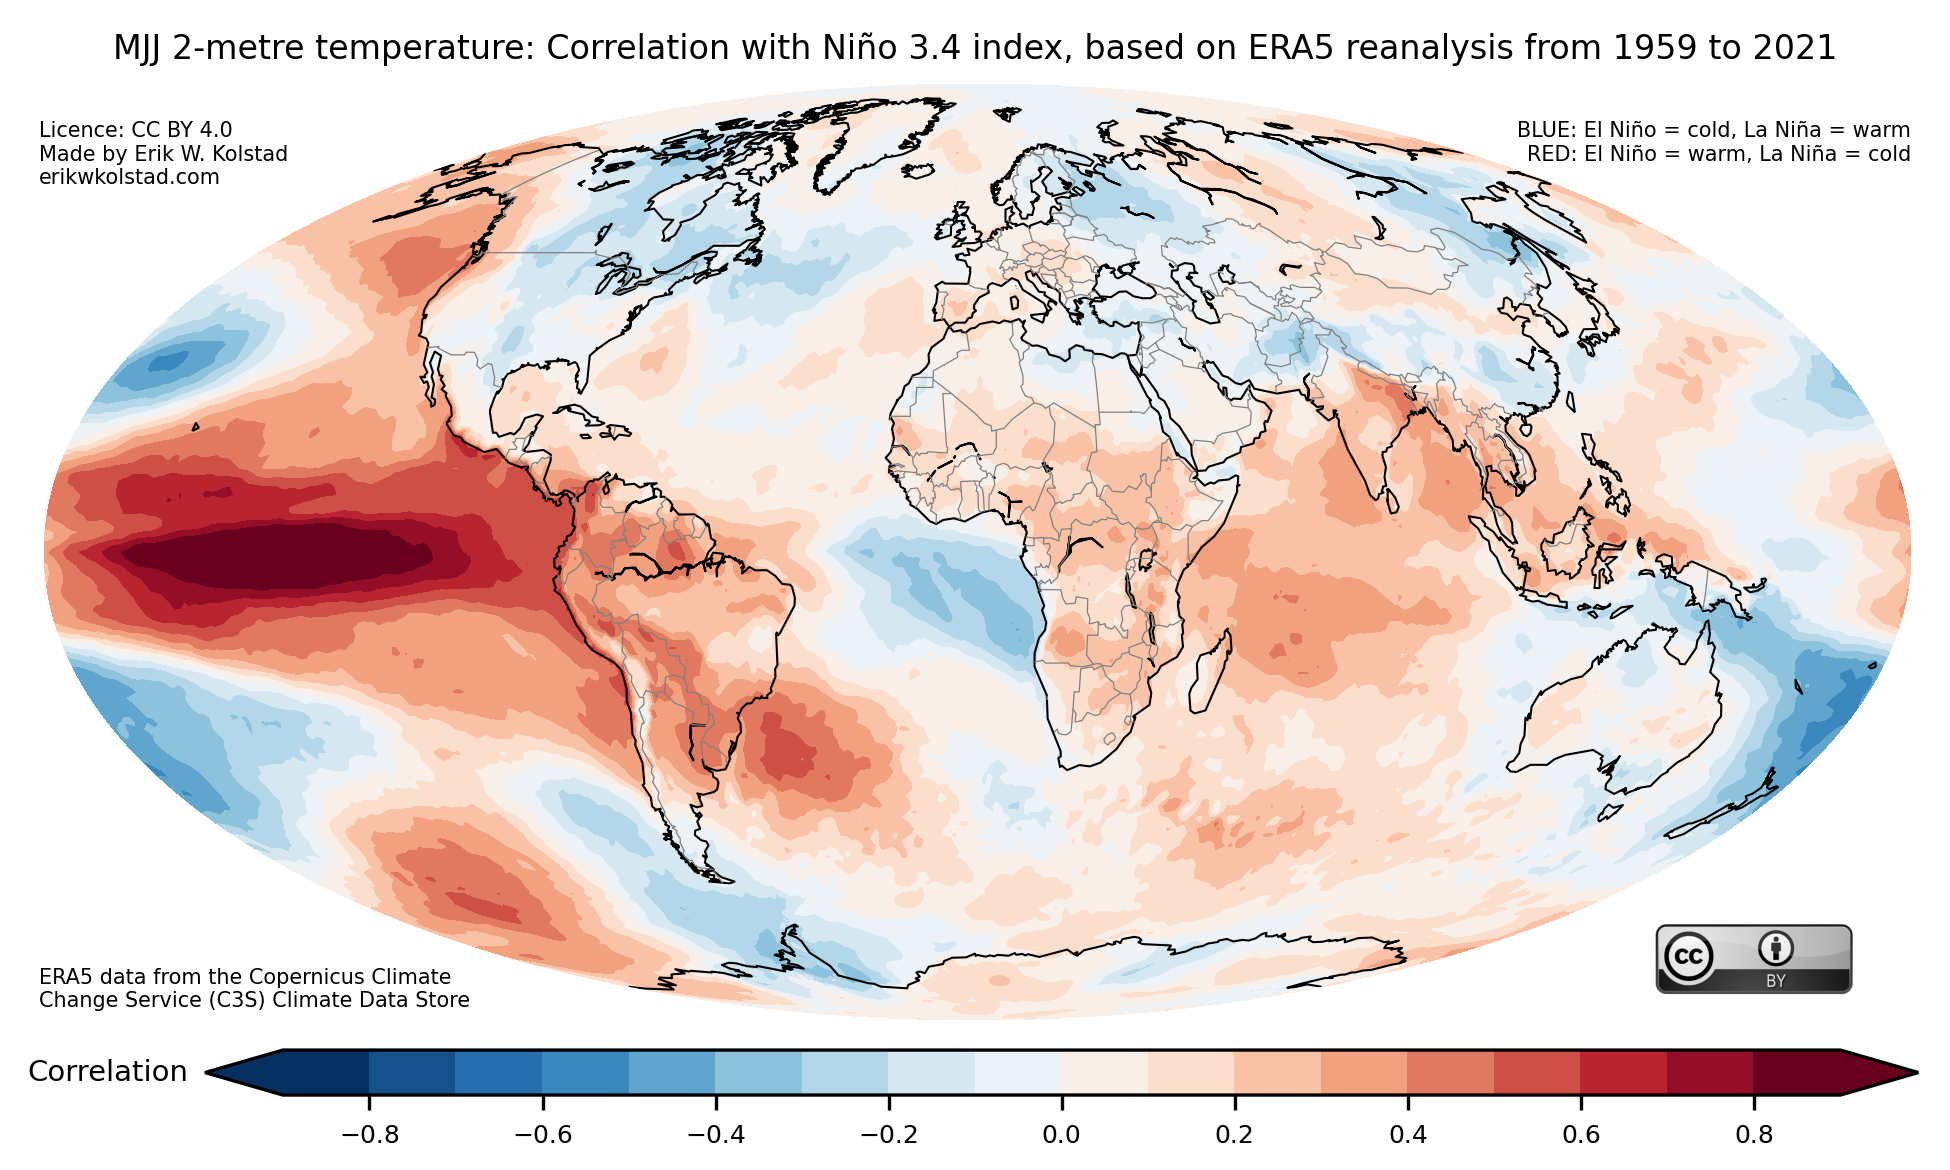
In the gallery below, you’ll find the temperature correlation maps for all 12 three-month periods.

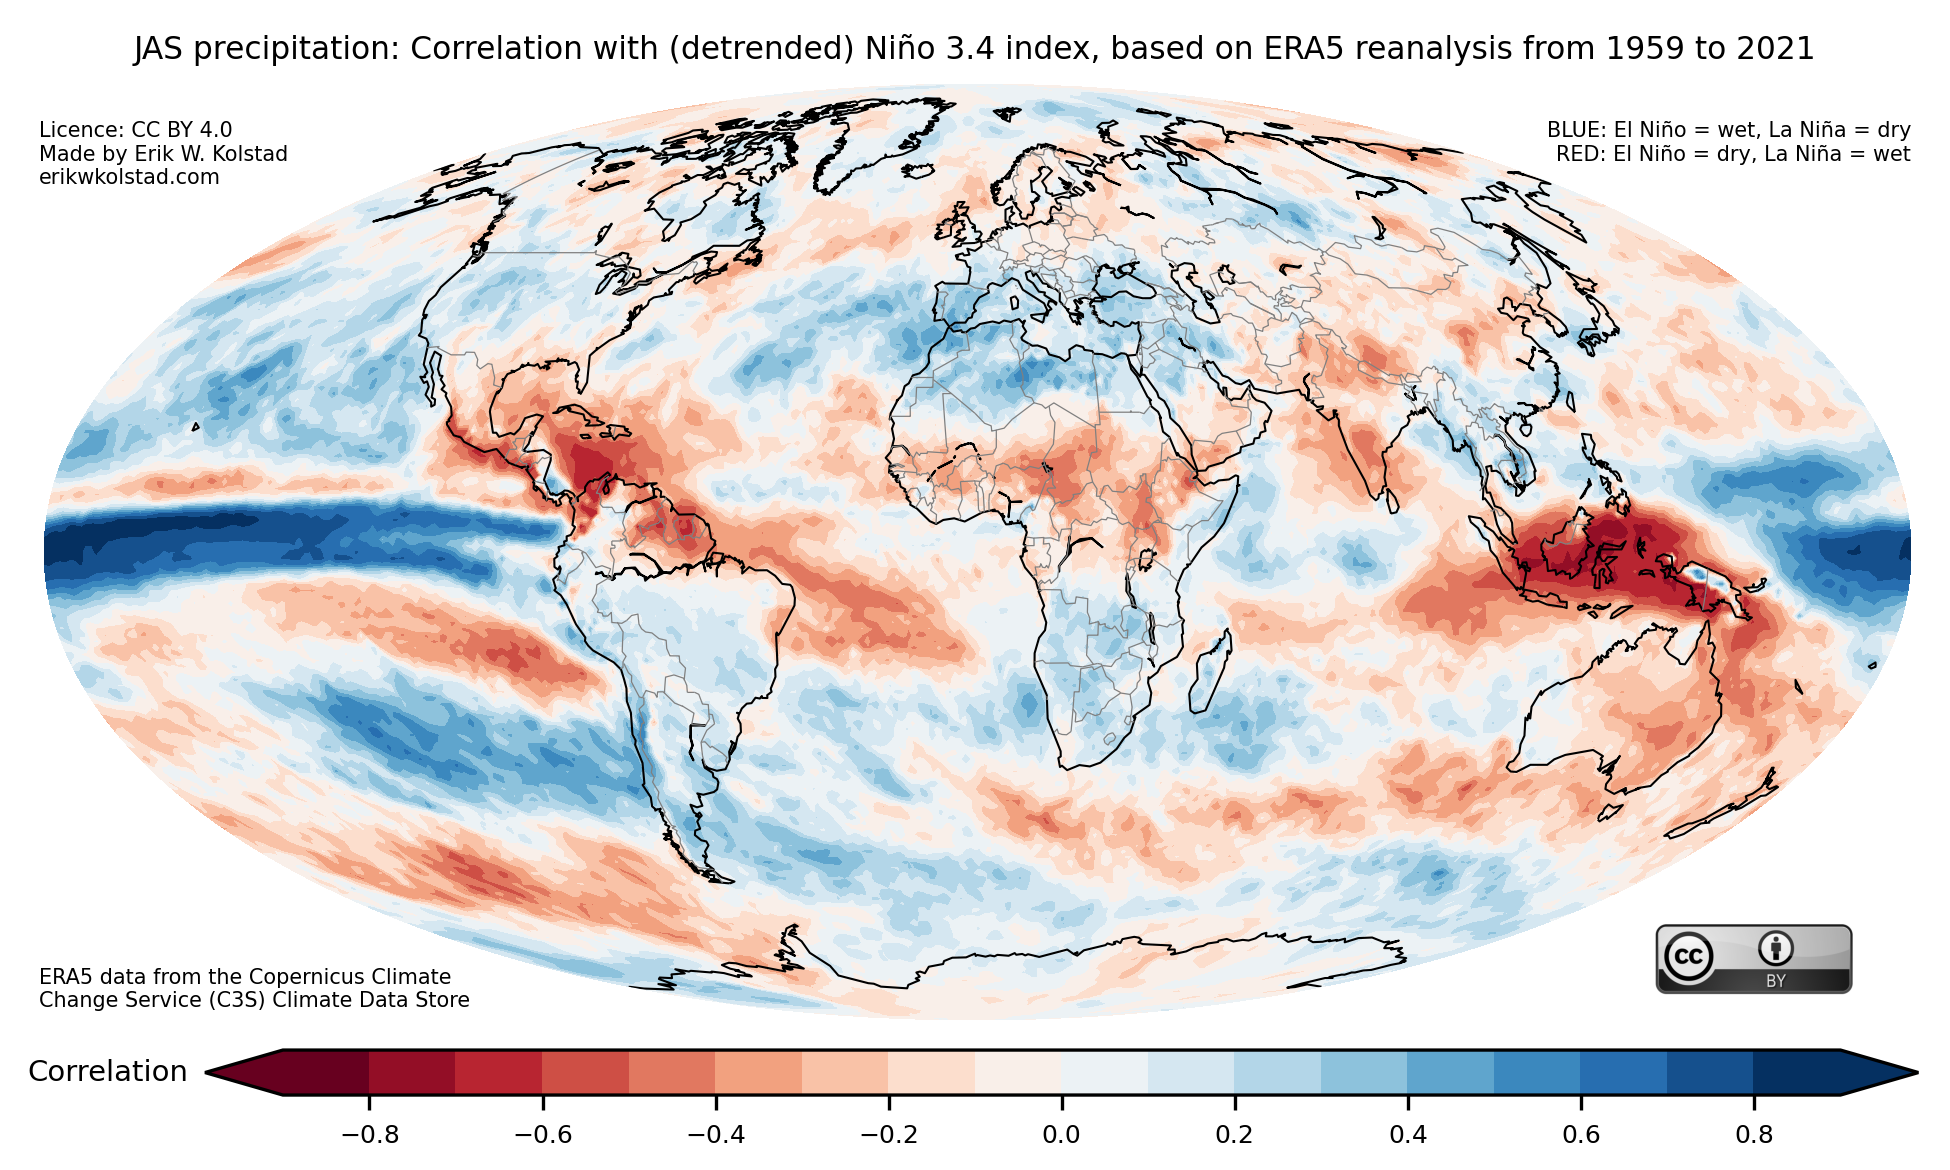
The gallery below shows the precipitation correlation maps for all three-month periods:

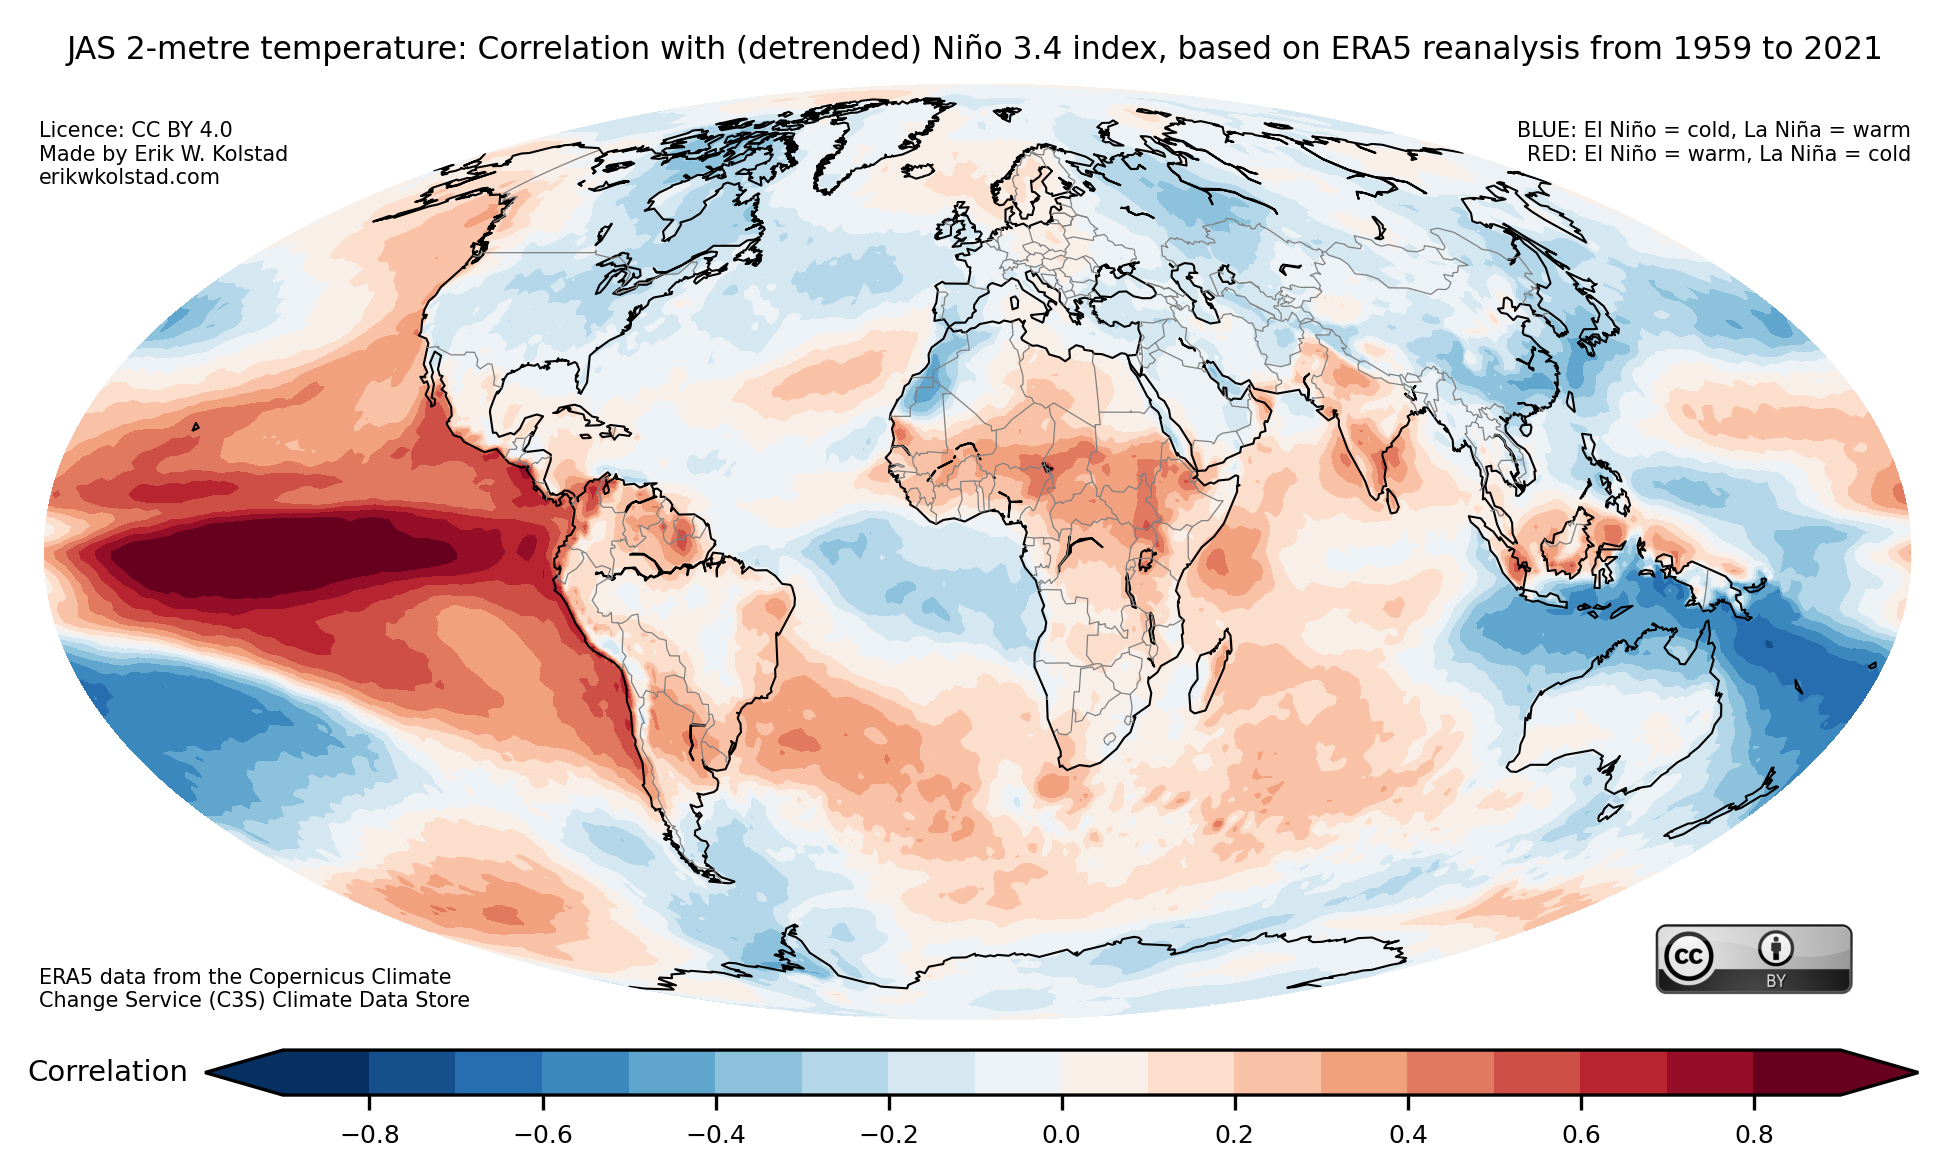
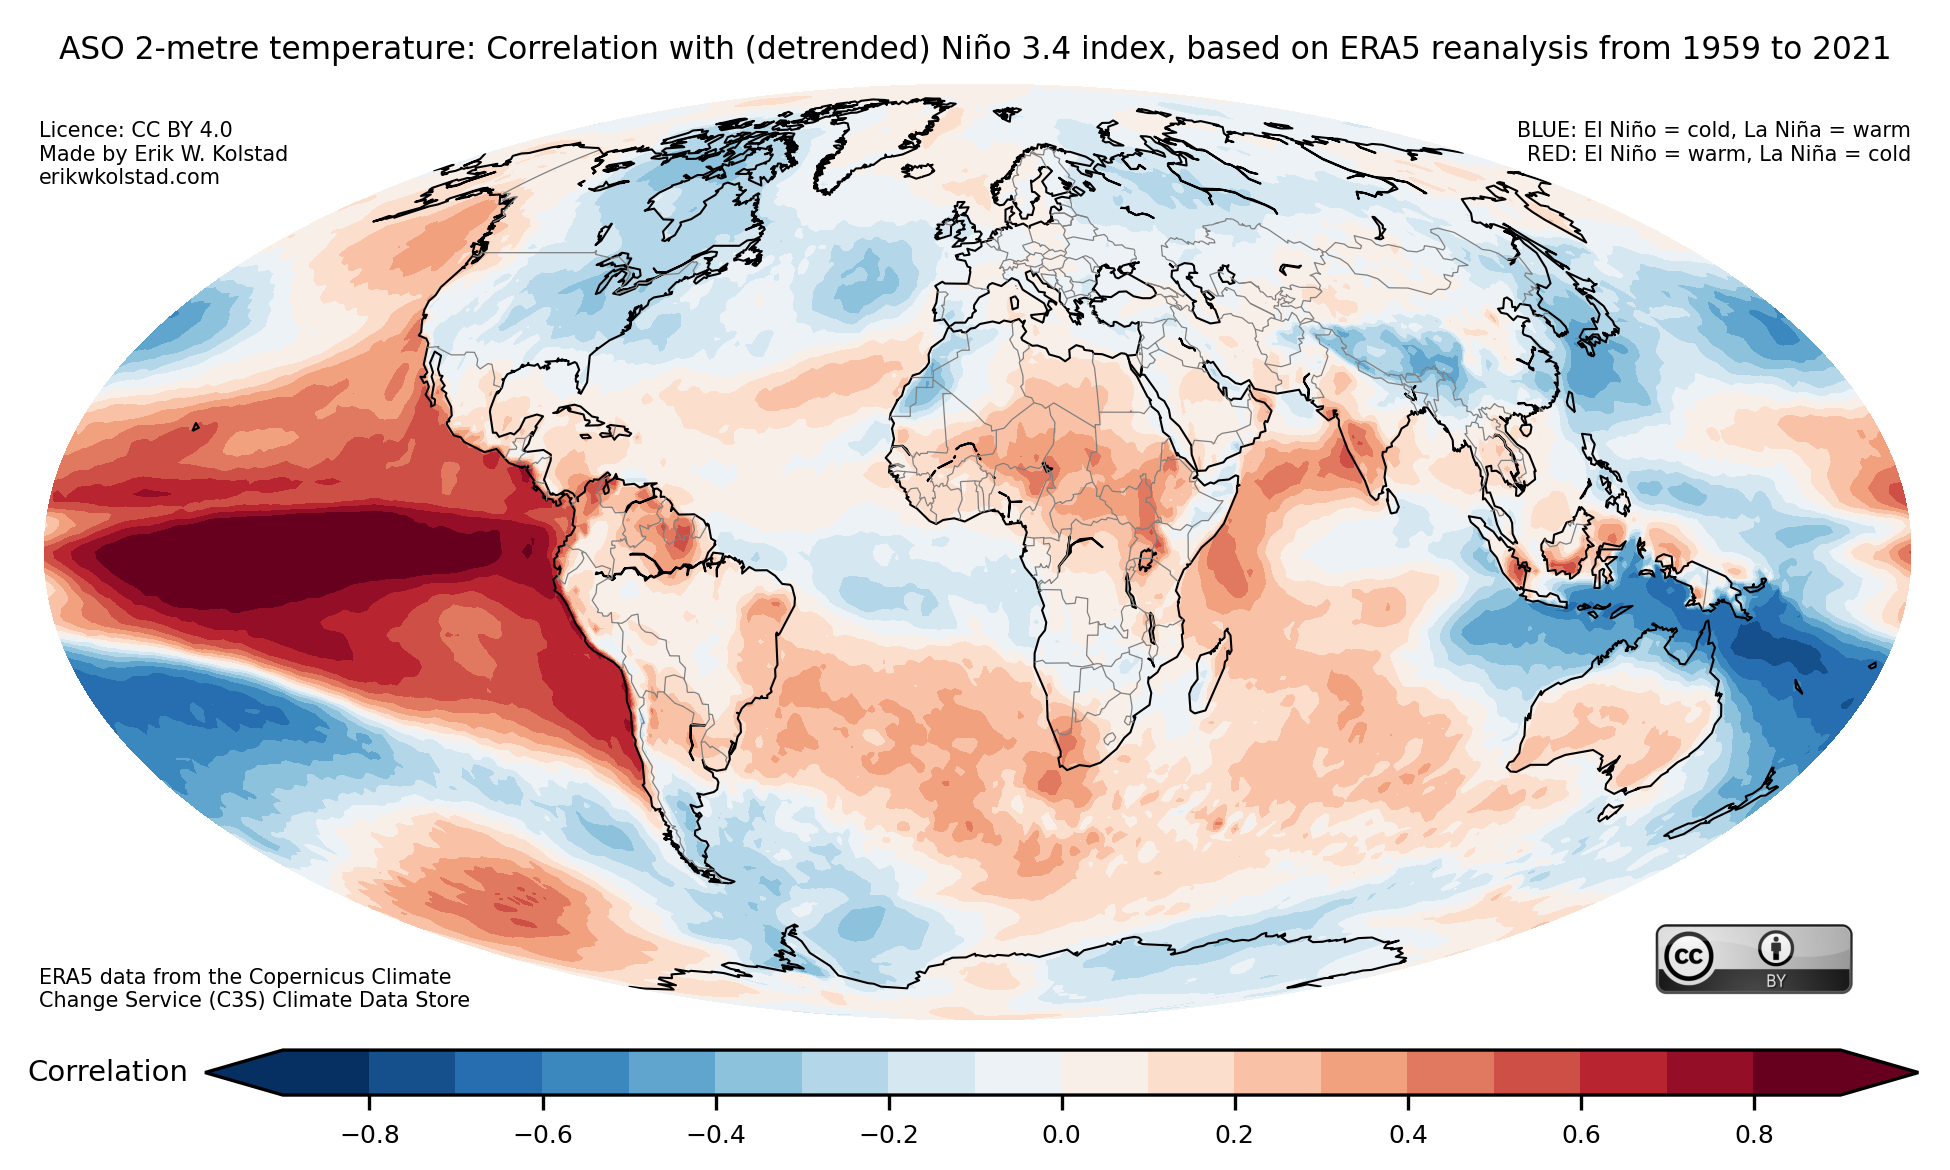
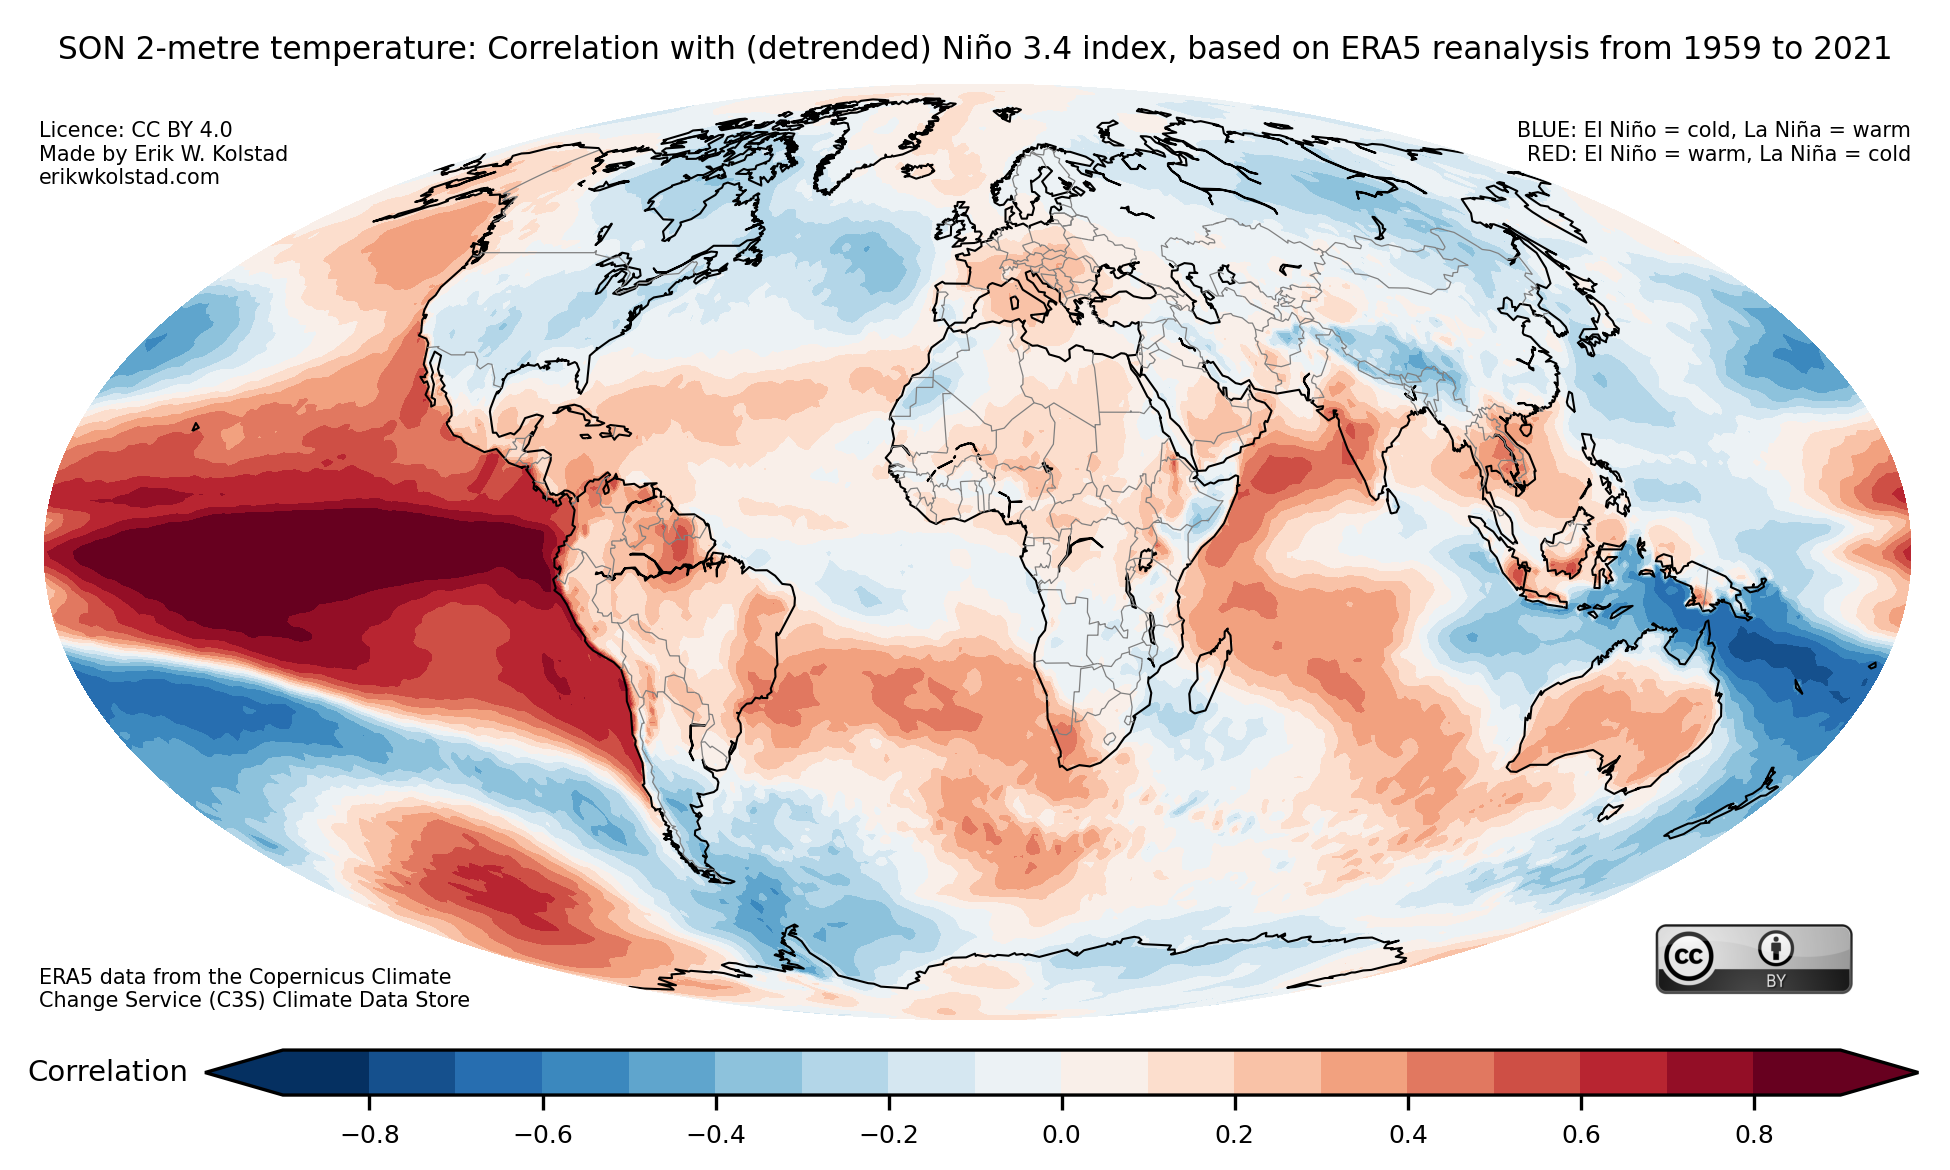
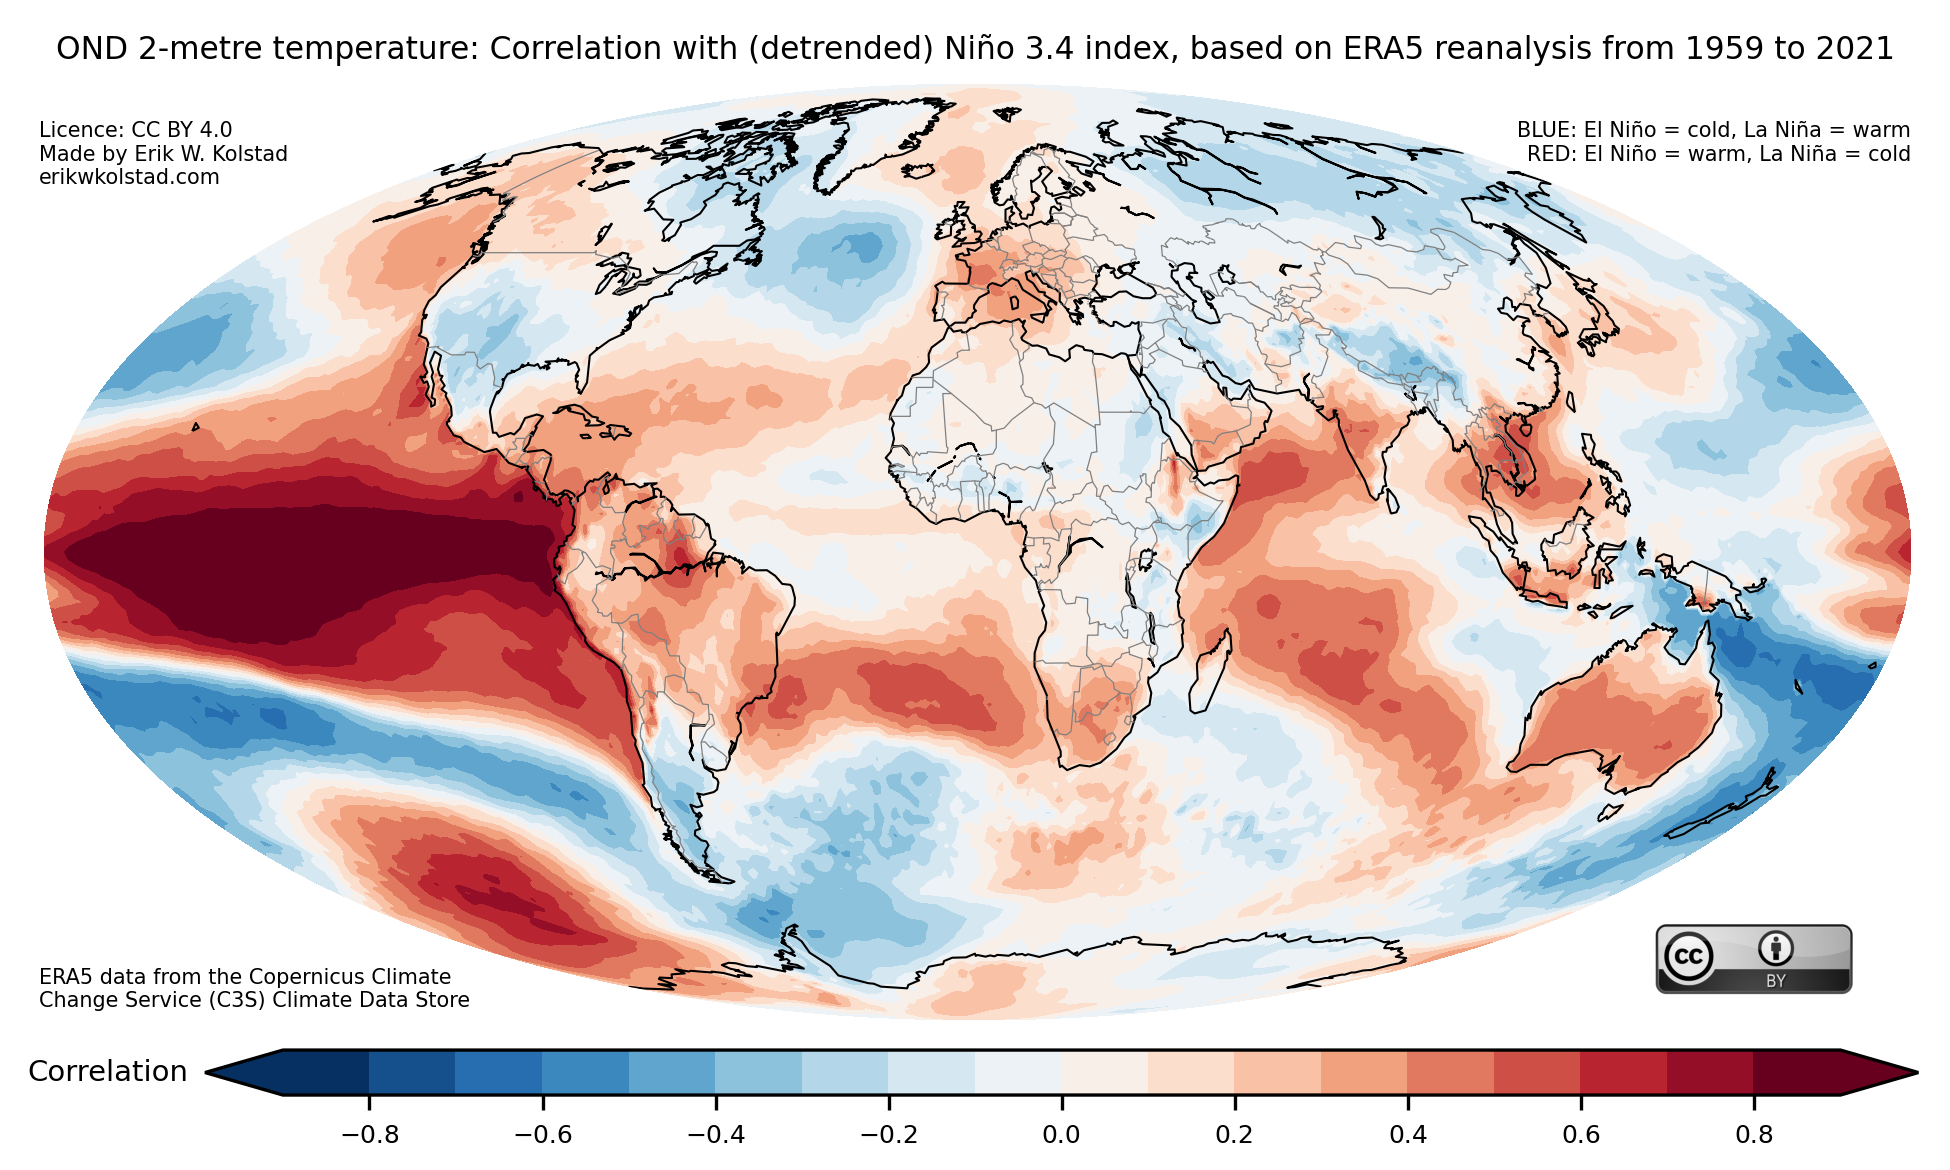
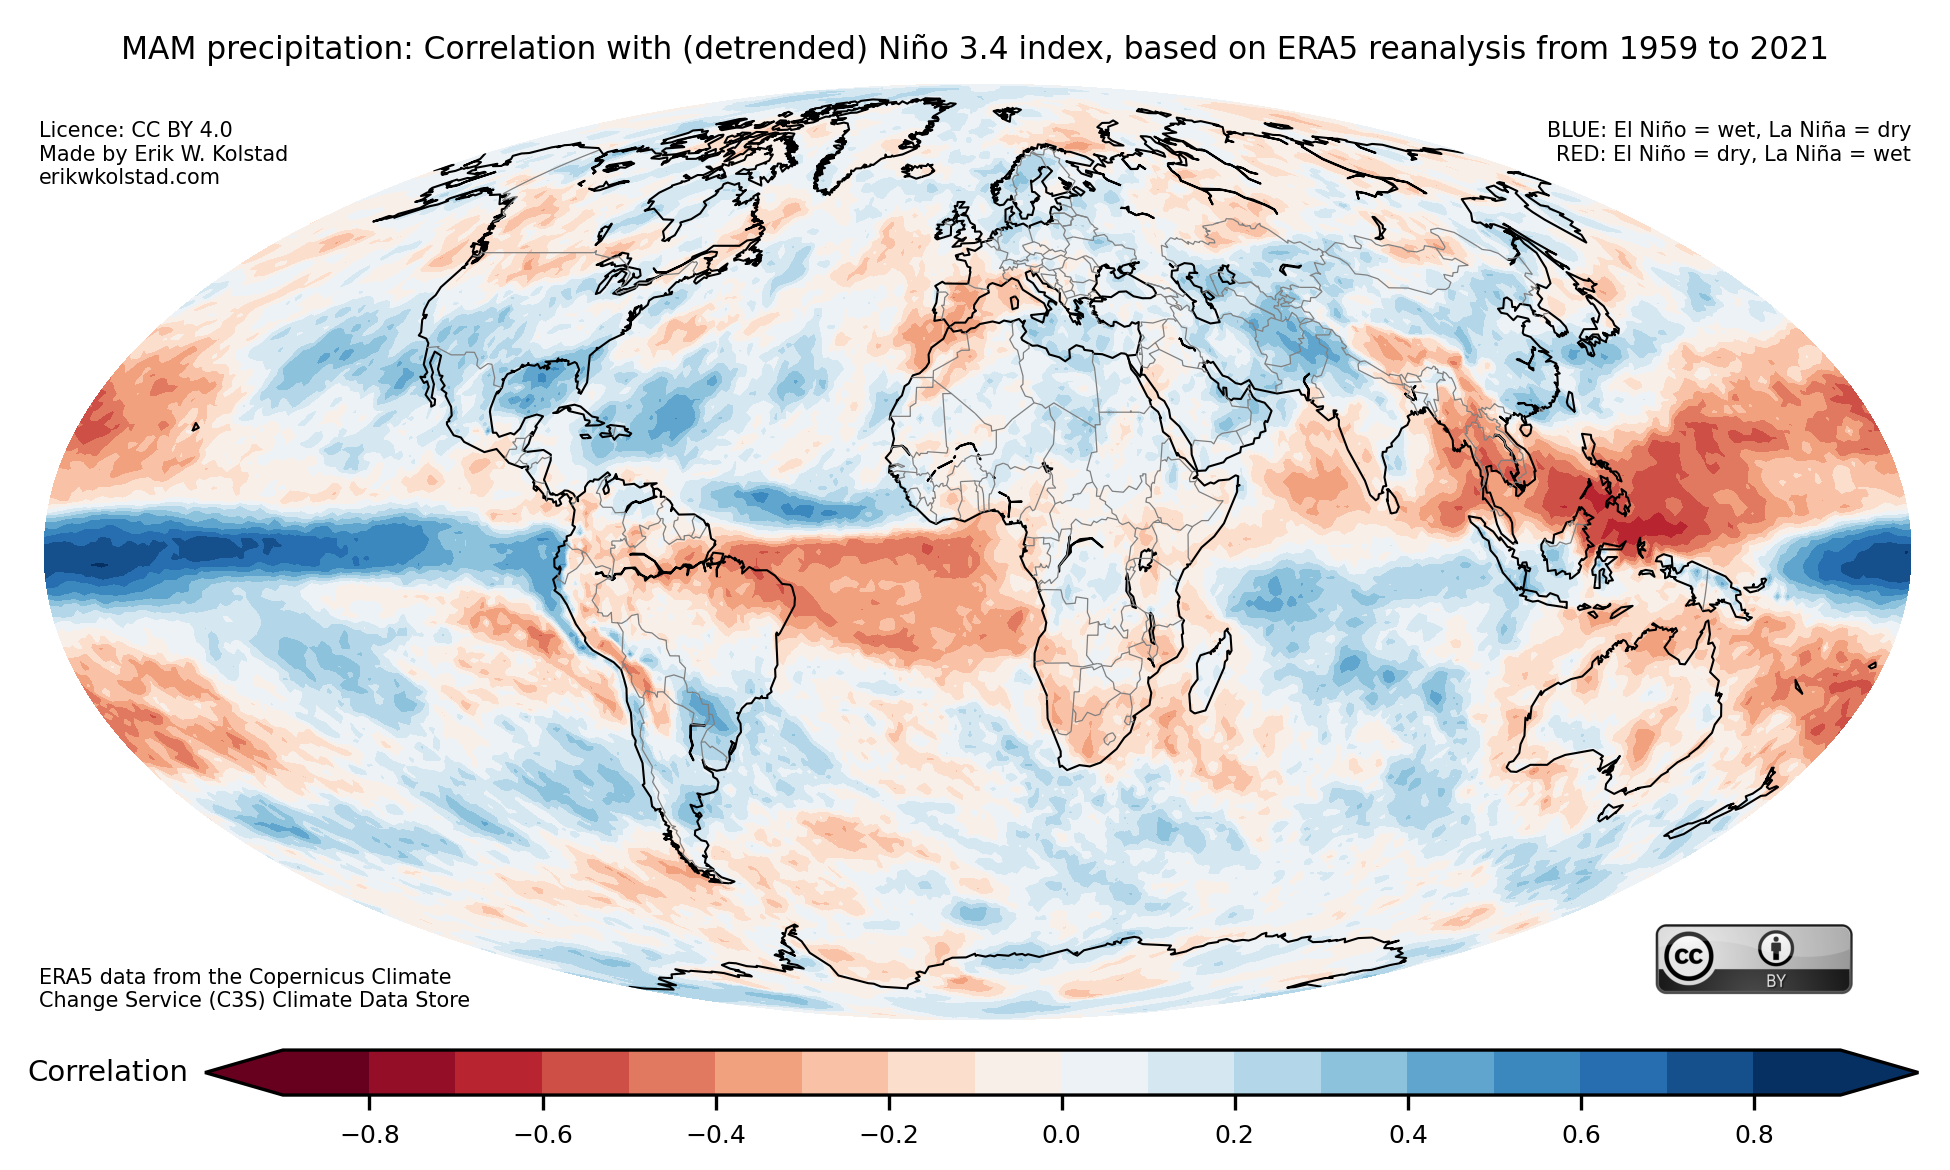
A final comment is that one should be conscious that some of the correlation is due to the substantial trends during the period shown. I’m therefore including figures based on linearly detrended data (although it doesn’t make a huge difference). Temperature first:

And finally precipitation:

Hva er en brå stratosfærisk oppvarming?

Følgende tekst er et redigert utdrag fra lydboken Uvær, som ble gitt ut i 2022.

Pussig nok har kalde vintre i Norge en tydelig kobling til stratosfæren, luftlaget som begynner 15–20 kilometer over hodene våre. Vinteren i 2009/10 var uvanlig kald. Midt på denne vinteren skjedde det vi kaller en brå stratosfærisk oppvarming. Dette er et fenomen som kjennetegnes av at temperaturen i stratosfæren over polområdene plutselig øker med flere titalls grader i løpet av noen få dager.

Ettersom luften ikke mottar noe solstråling om vinteren, er denne luften vanligvis kald. I frontsonen mellom den kalde luften og varmere luft lenger sør, blåser det en kraftig vind i høyden. Den sterkeste vinden finner vi som oftest på omtrent 30 kilometers høyde på omtrent 60 grader nord, altså rett over Bergen og Oslo. Vinden blåser fra vest mot øst.

Når stratosfæren over polområdet plutselig varmes opp, som regel ved at varm luft strømmer til fra sør, bryter fronten sammen. Det betyr igjen at den sterke vestavinden svekkes eller til og med snur om og blir en østavind. Nede på bakken går da værmønsteret NAO, som er viktig for været i Europa, ofte inn i en negativ fase. Dette betyr at de vestavindene som fører med seg lavtrykk inn mot kysten vår fra Nord-Atlanteren svekkes. Konsekvensen for oss er at det blir mye kaldere, og i stedet for mild og fuktig luft fra sørvest får vi tilført kalde og tørre luftmasser fra øst. Slik henger sibirske høytrykk og fimbulvintre i Skandinavia sammen med det som skjer i stratosfæren i en slags kjedereaksjon.

Stratosfæriske oppvarminger er ikke et sjeldent fenomen. Etter den i februar 2010 har det skjedd flere ganger: i januar 2013, februar 2018, januar 2019, og den foreløpig siste i rekken i januar 2021. Denne siste hendelsen gjorde at det som så ut som starten på en mild vinter i desember 2020, plutselig slo om til en lang og kald periode i januar og februar 2021. En av de mest ekstreme endringene så vi i Trondheim, der temperaturen i desember 2020 var 3,5 grader høyere enn normalt, mens januar 2021 var hele 4,2 grader kaldere enn normalen.