
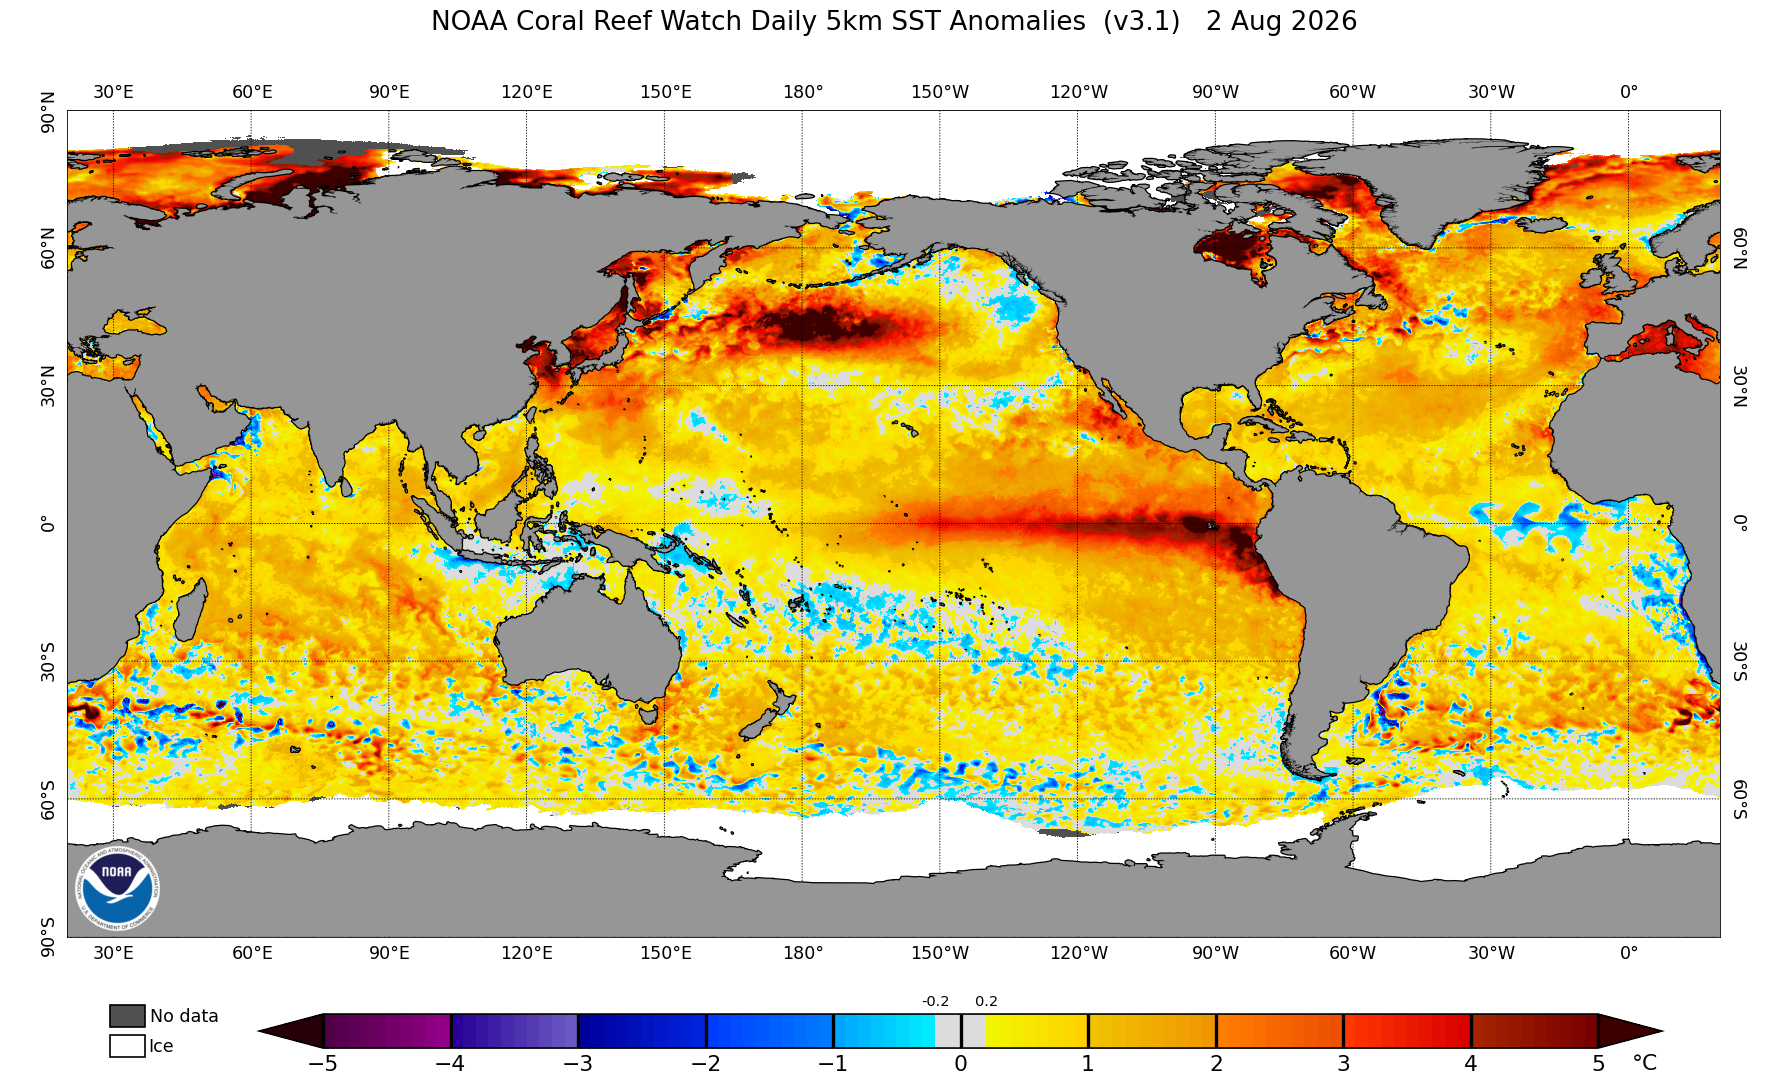
The ongoing El Niño episode is already strong now at the beginning of August, 2026. Here’s a picture of the current sea surface temperature (SST) anomalies:
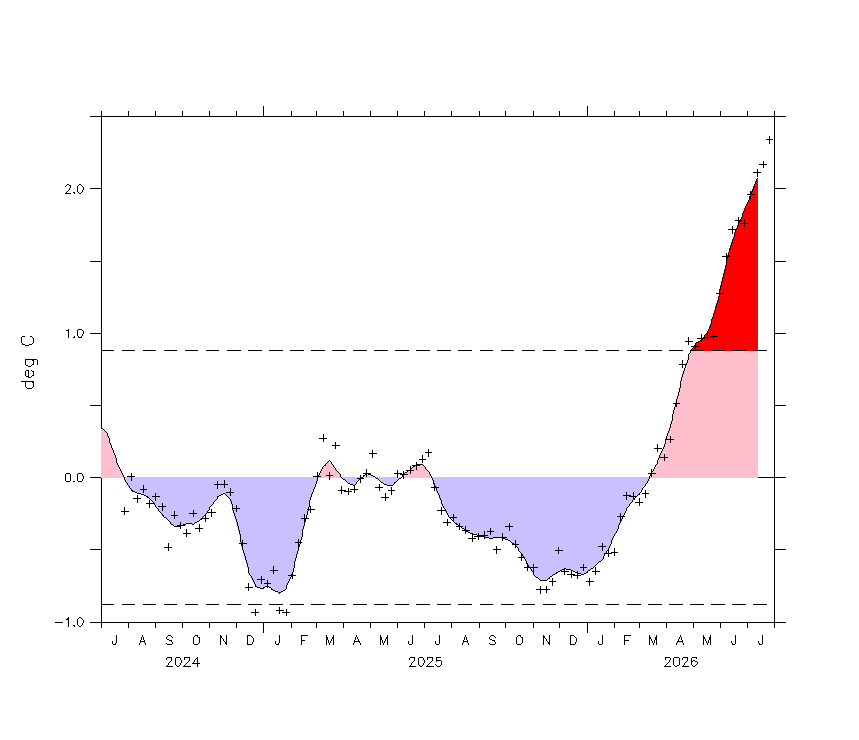
To gauge the strength of El Niño or La Niña, we use a time series based on the SST anomalies in the eastern Equatorial Pacific. The most widely used indicator is the Niño 3.4 index. The graph below shows the recent evolution of this index. It’s clearly gaining in strength going into the boreal autumn (El Niño usually peaks in boreal winter).
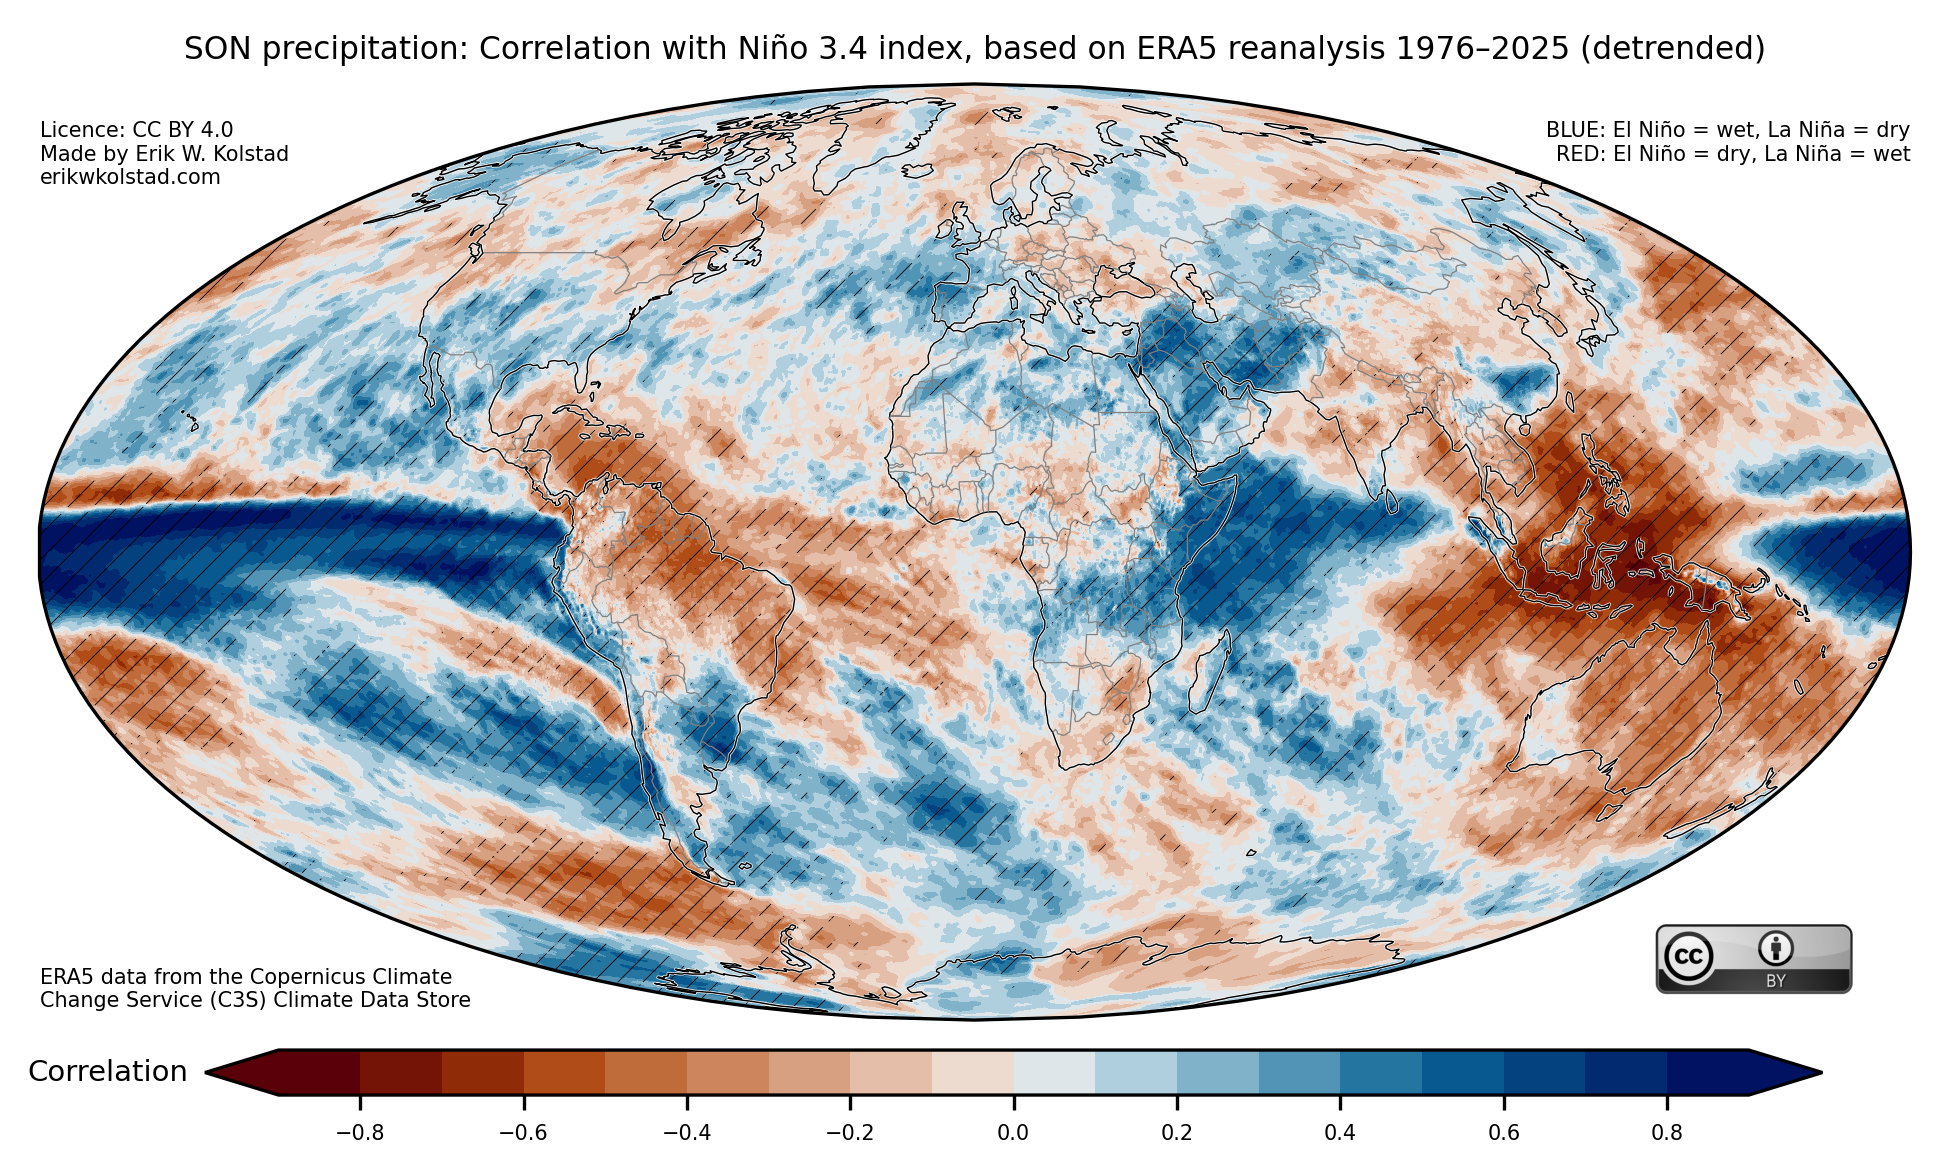
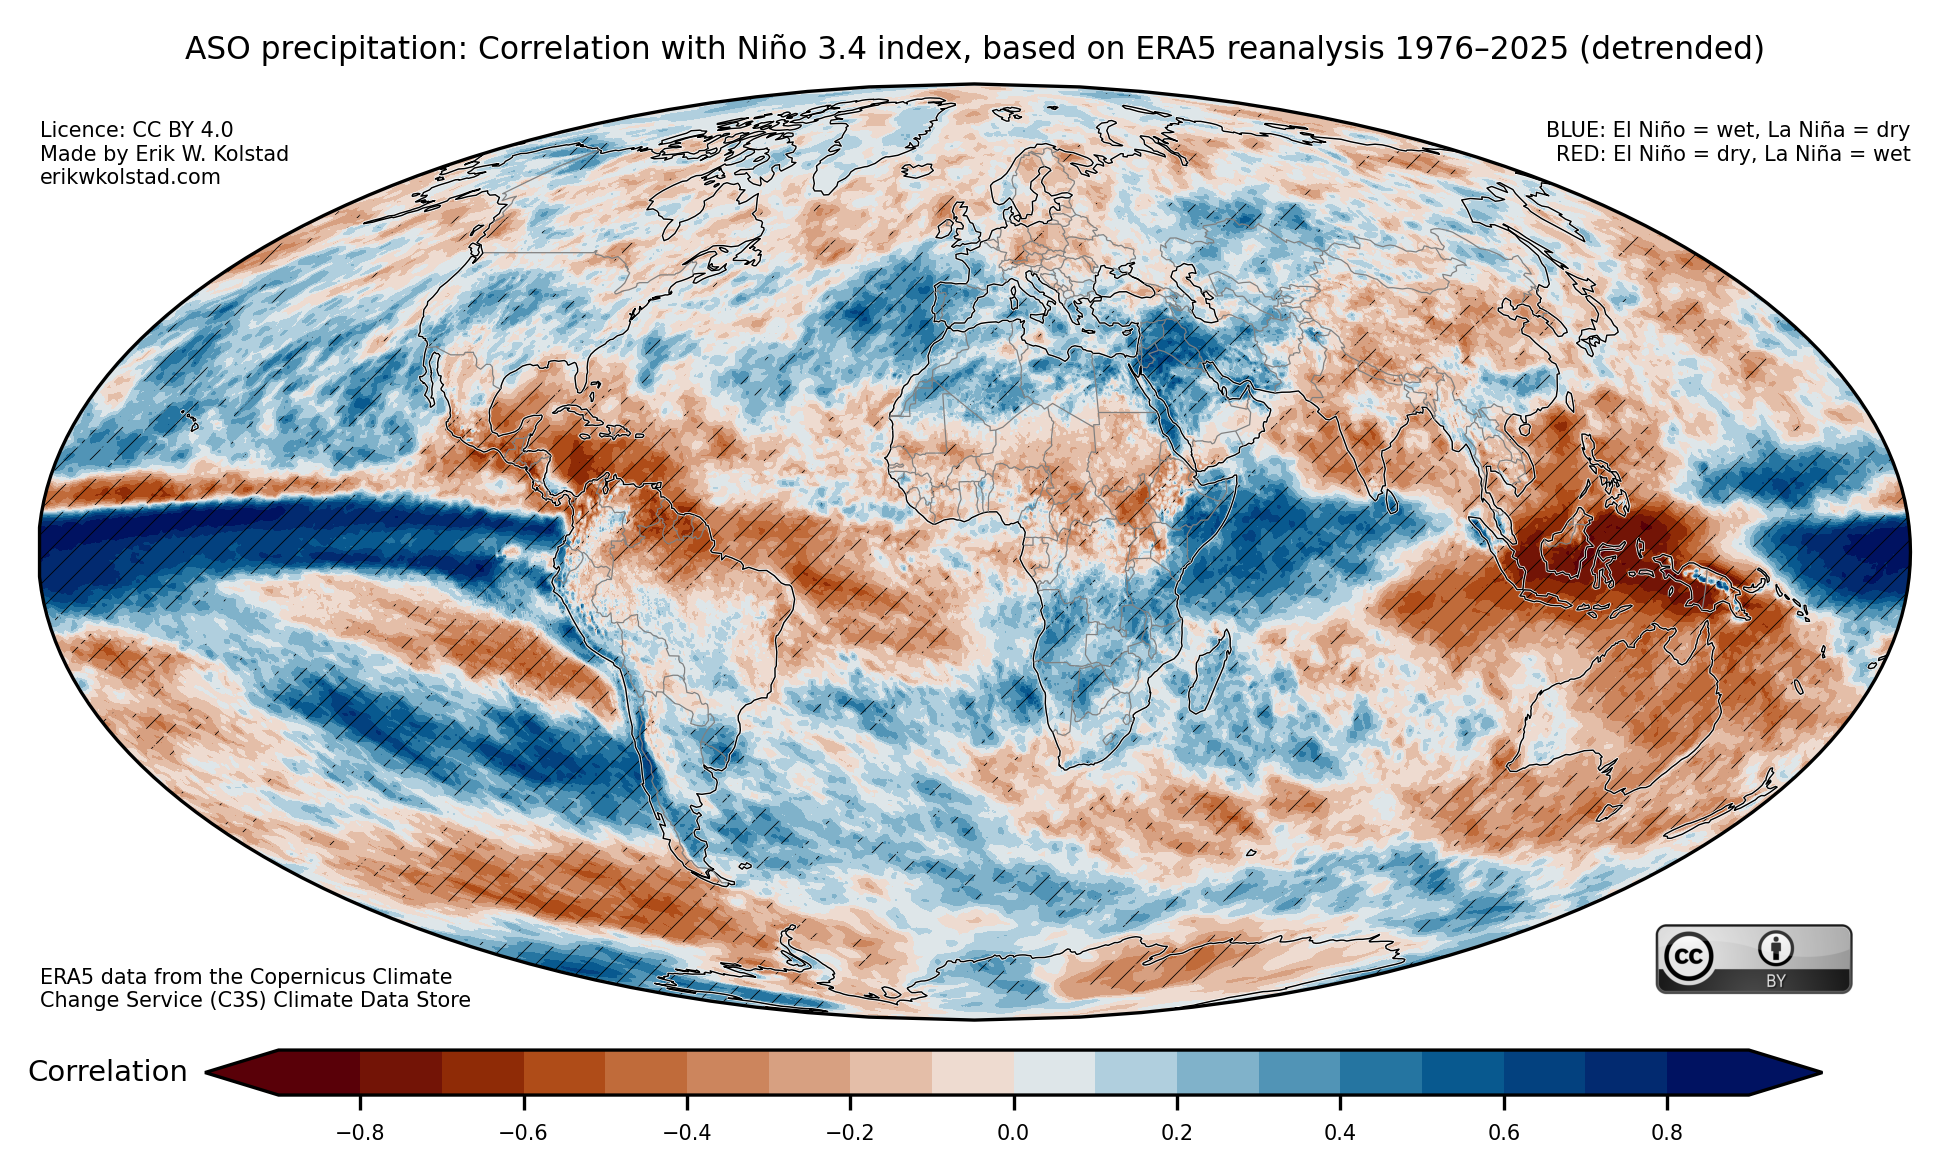
I’ve previously posted a series of pictures that show the correlation between the Niño 3.4 index and global precipitation. Here’s the map for boreal autumn (September to November):
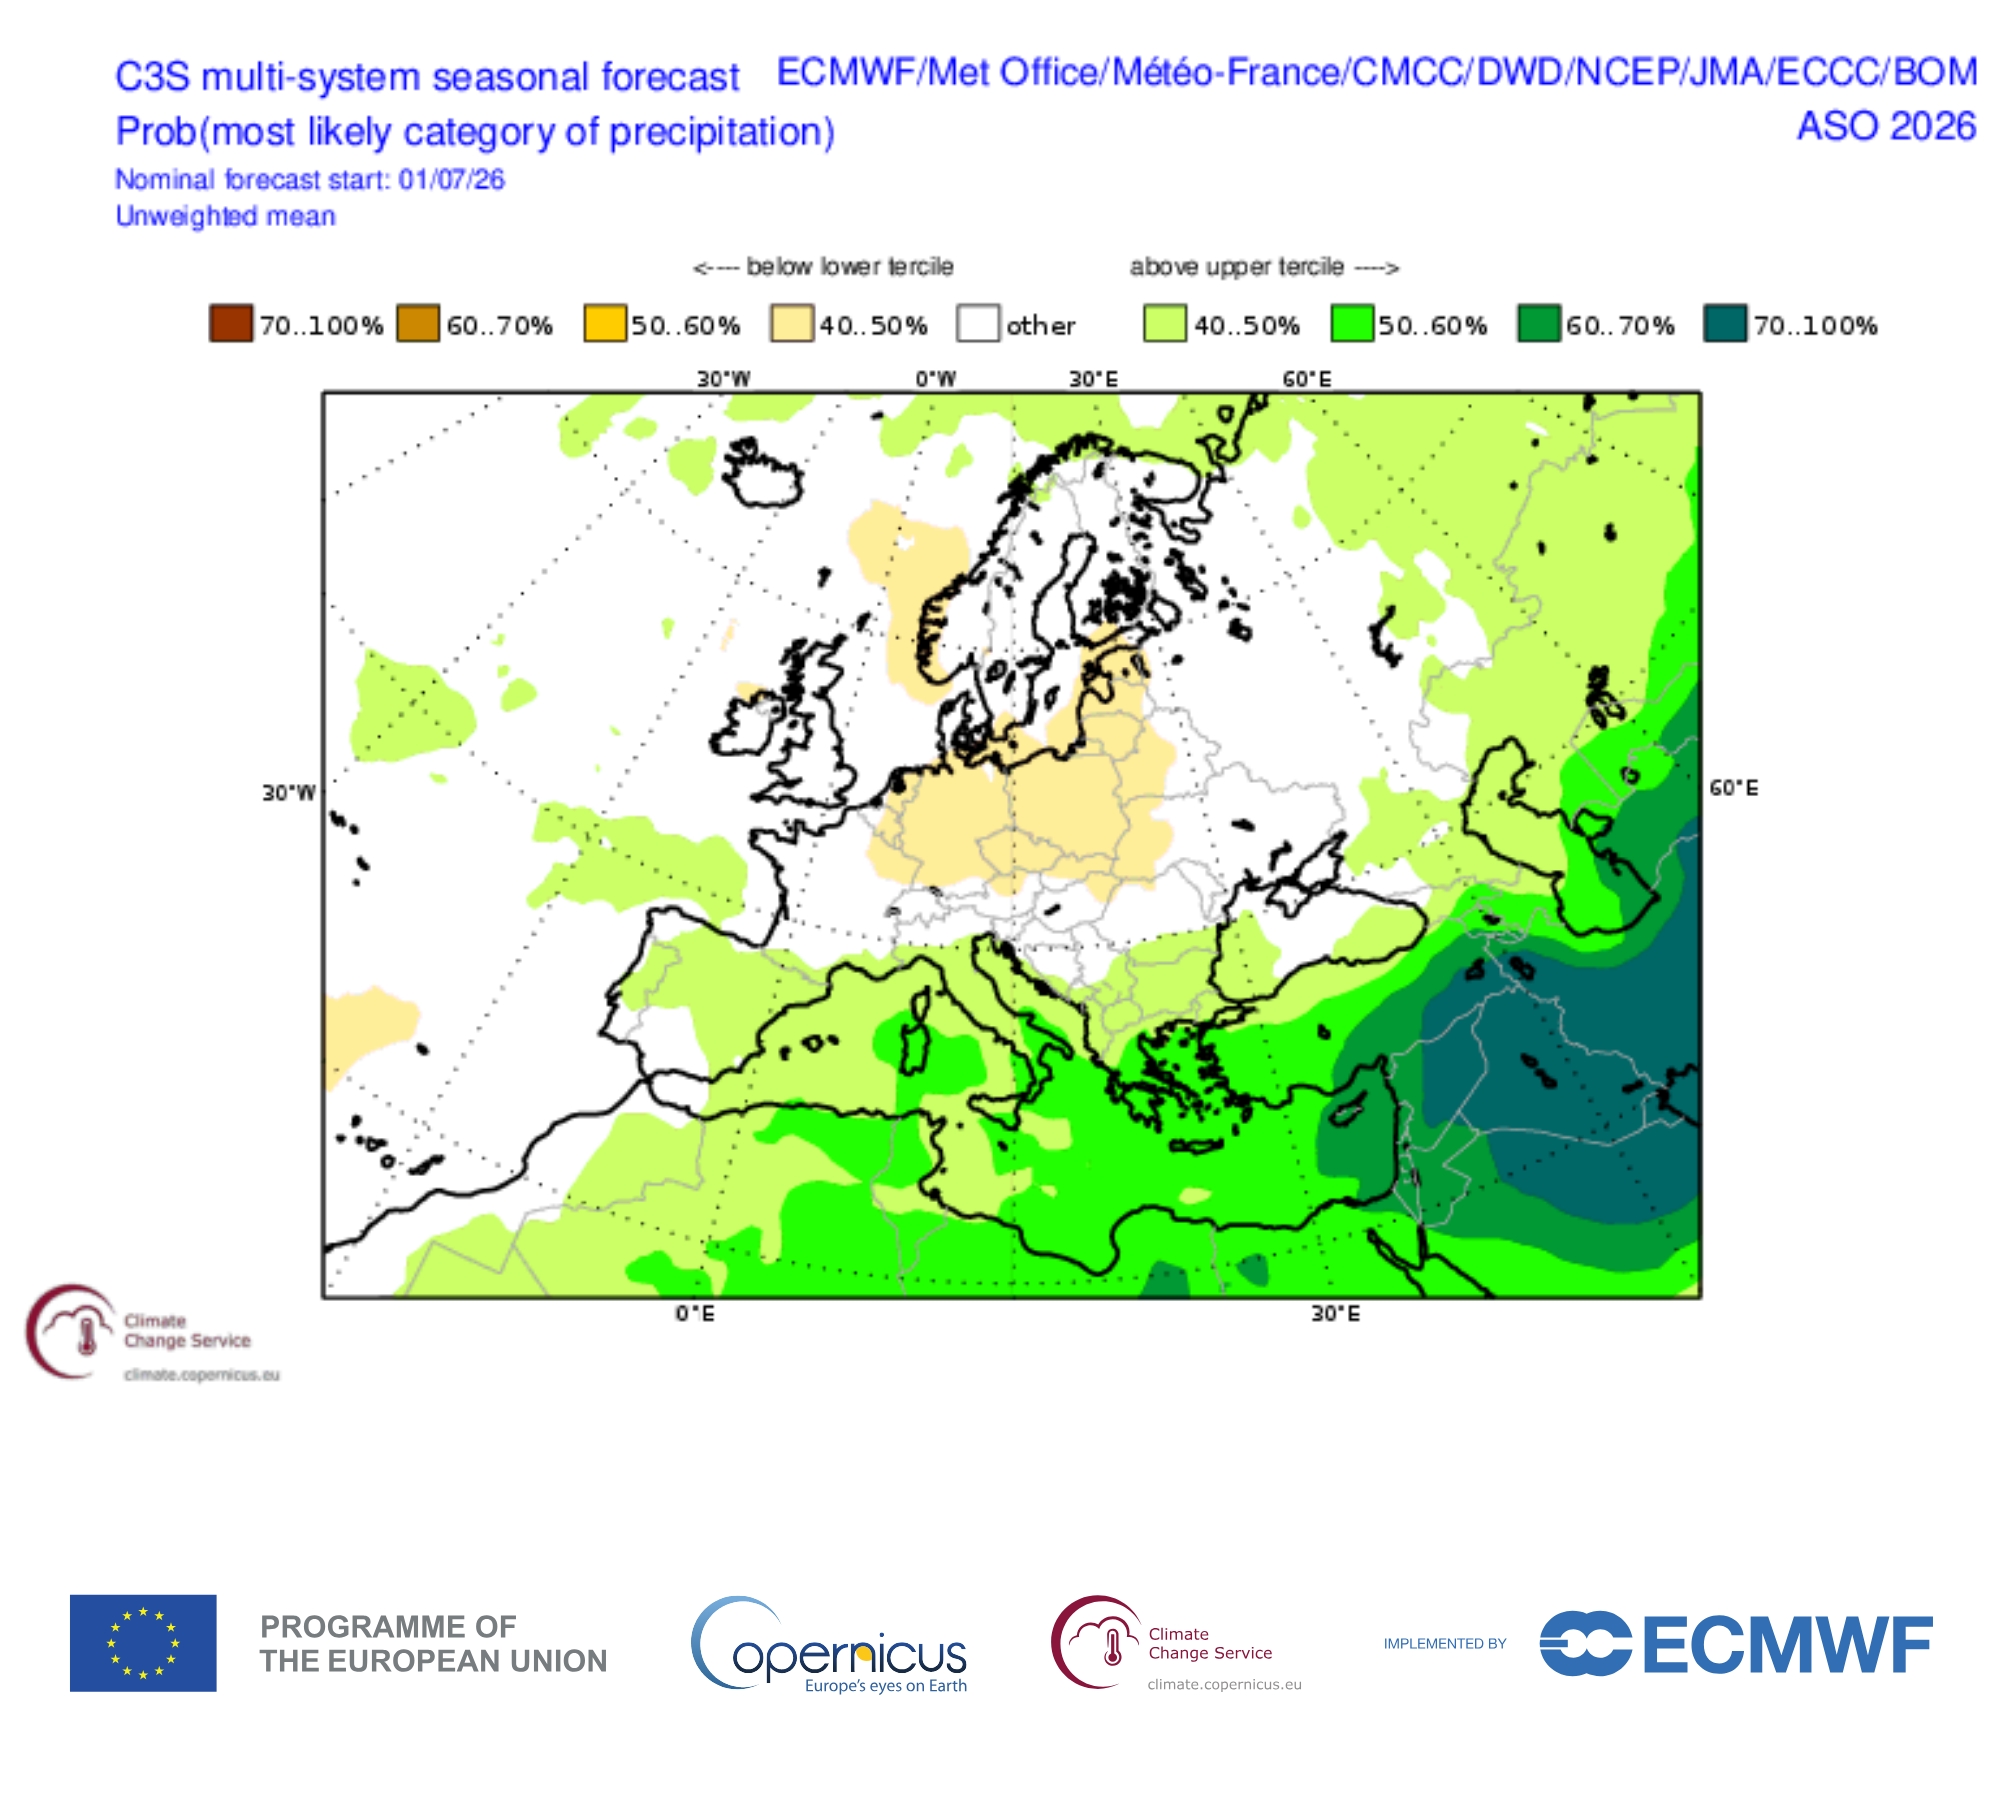
Looking at the multi-model seasonal precipitation forecasts collected by the Copernicus Climate Change Service (C3S) below, they are broadly similar. If the forecasts turn out to be right, the global precipitation this autumn will be dominated by the current El Niño. However, Beverly et al. (2023) showed that the seasonal forecast exhibit systematic biases – leading to forecast errors – when they are initialised during El Niño episodes, like now.
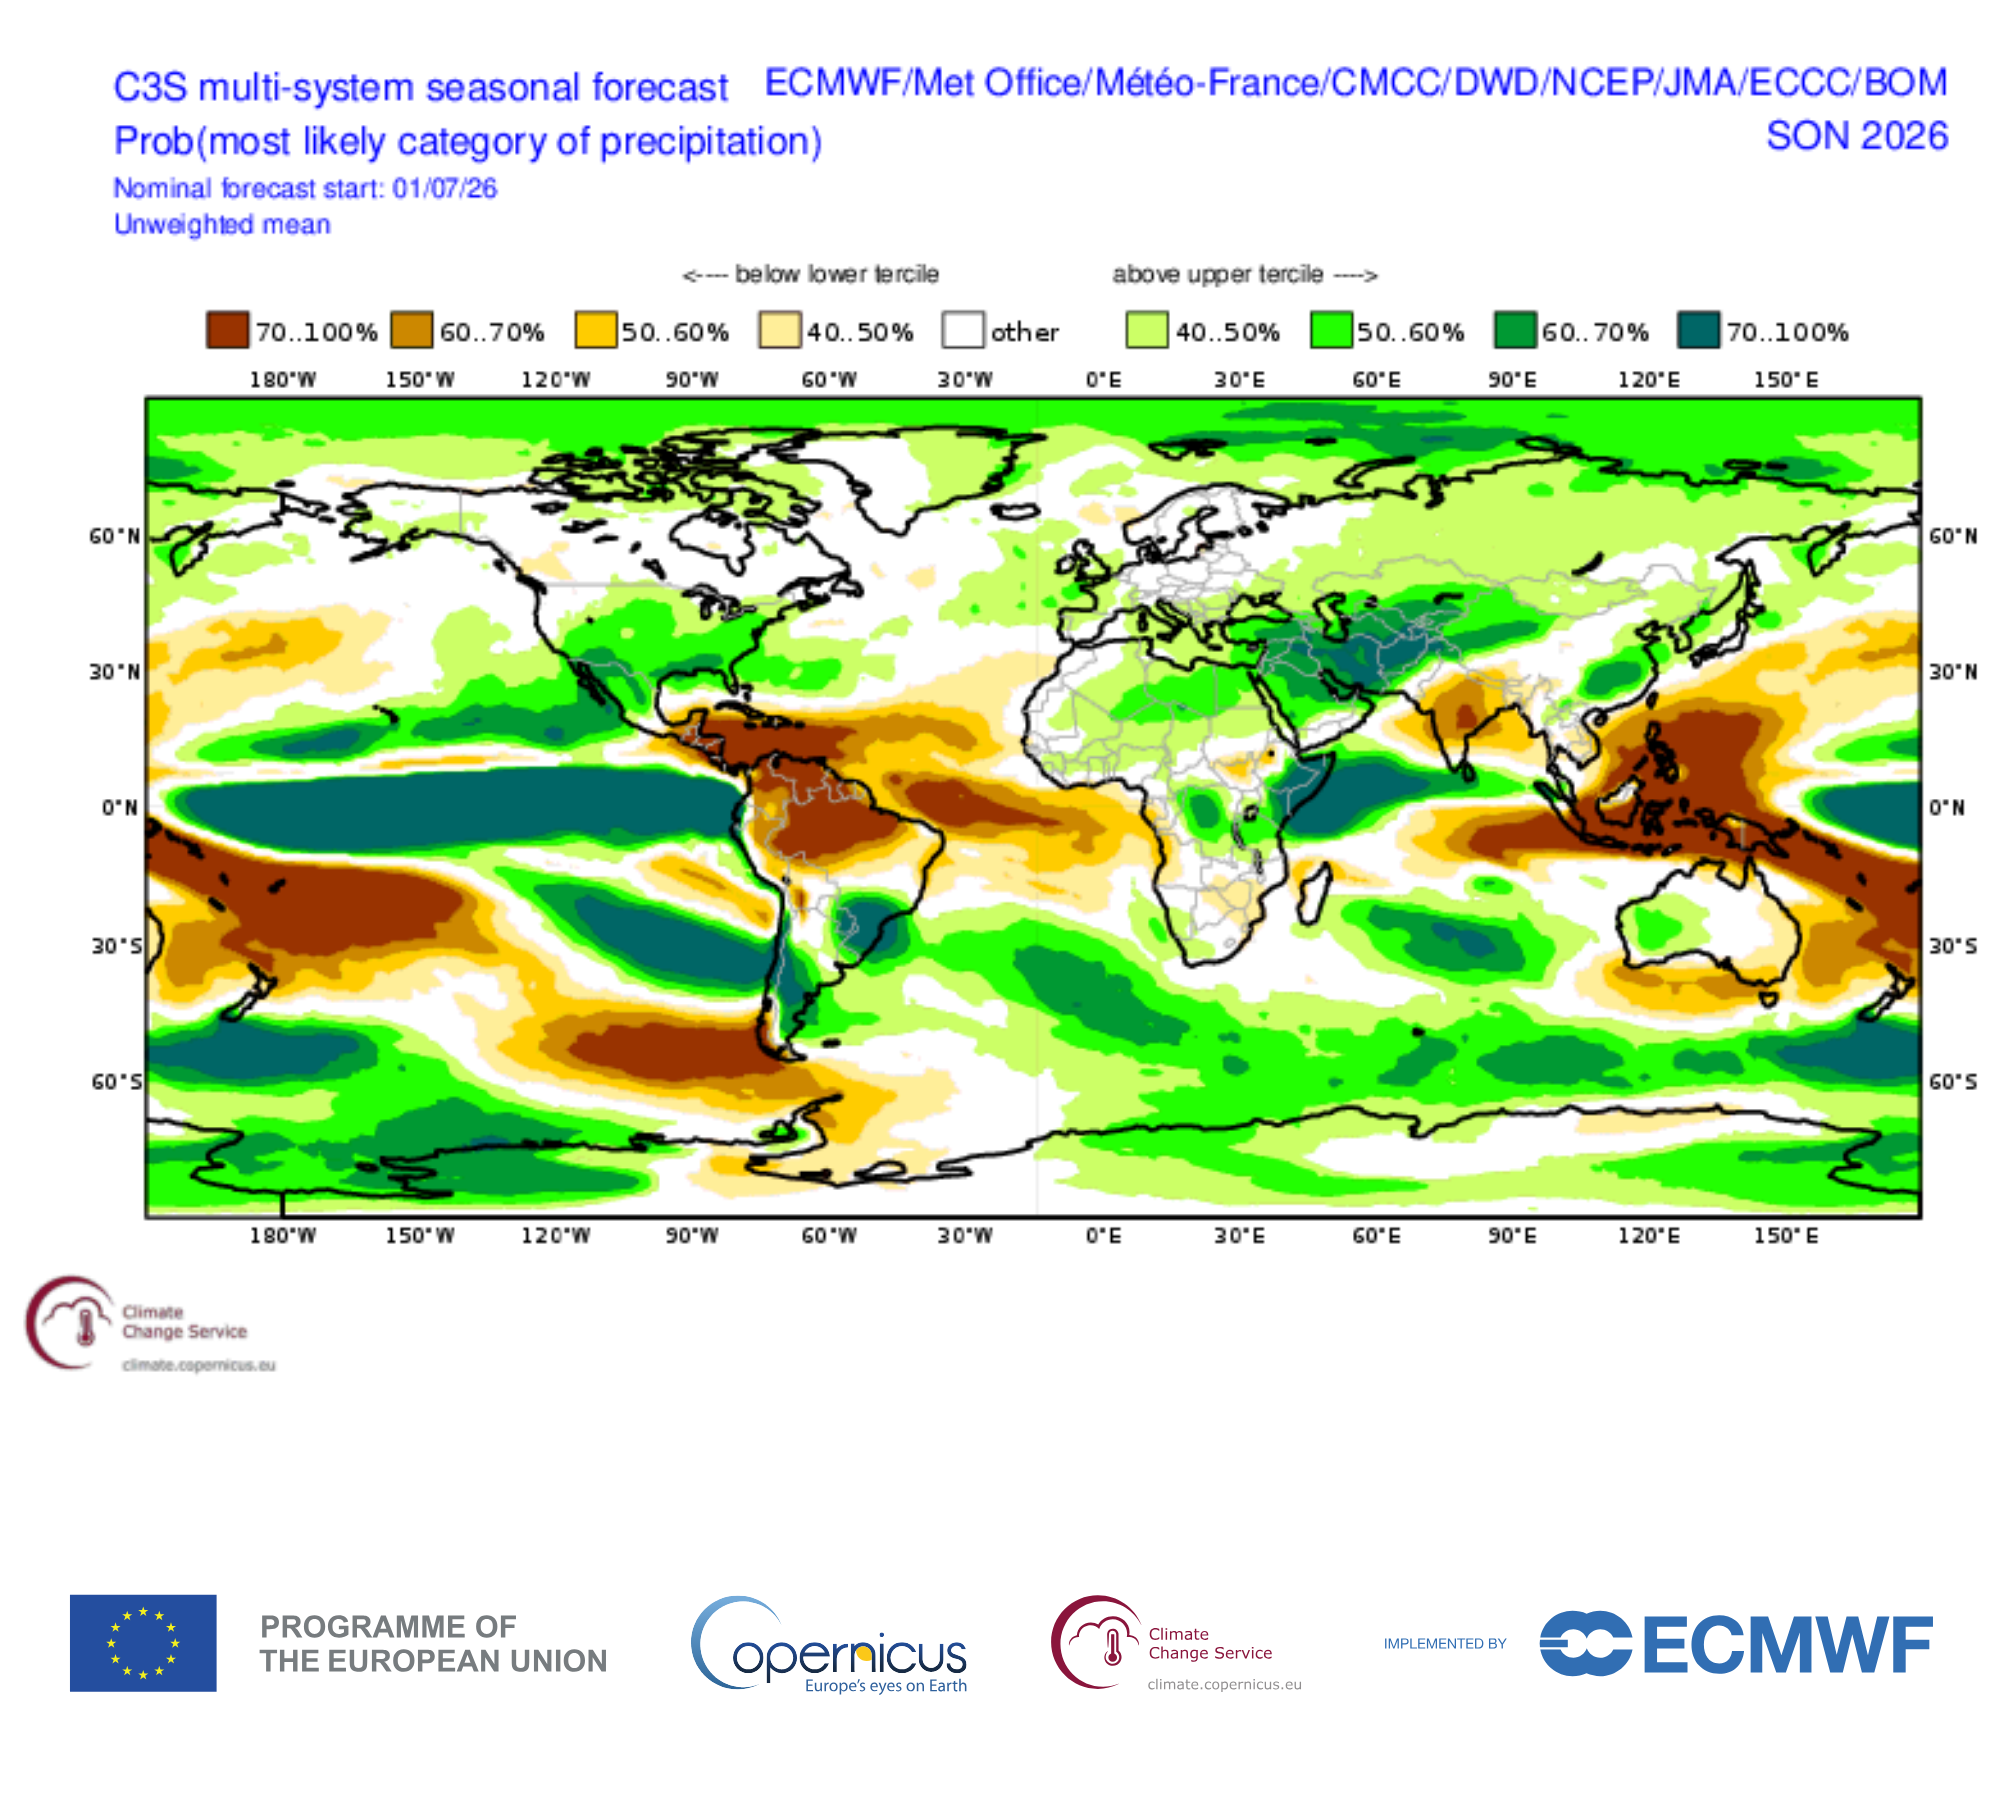
Still, for western Europeans, both the forecasts and the historical El Niño record yield hope that there may be relief on the way in the form of wetter weather. This is also the case for the more immediate three-month period from August to October:
However, the map below shows no clear wet signal in the seasonal forecast models. Let’s hope the history trumps the models this year.
 Erik Kolstad