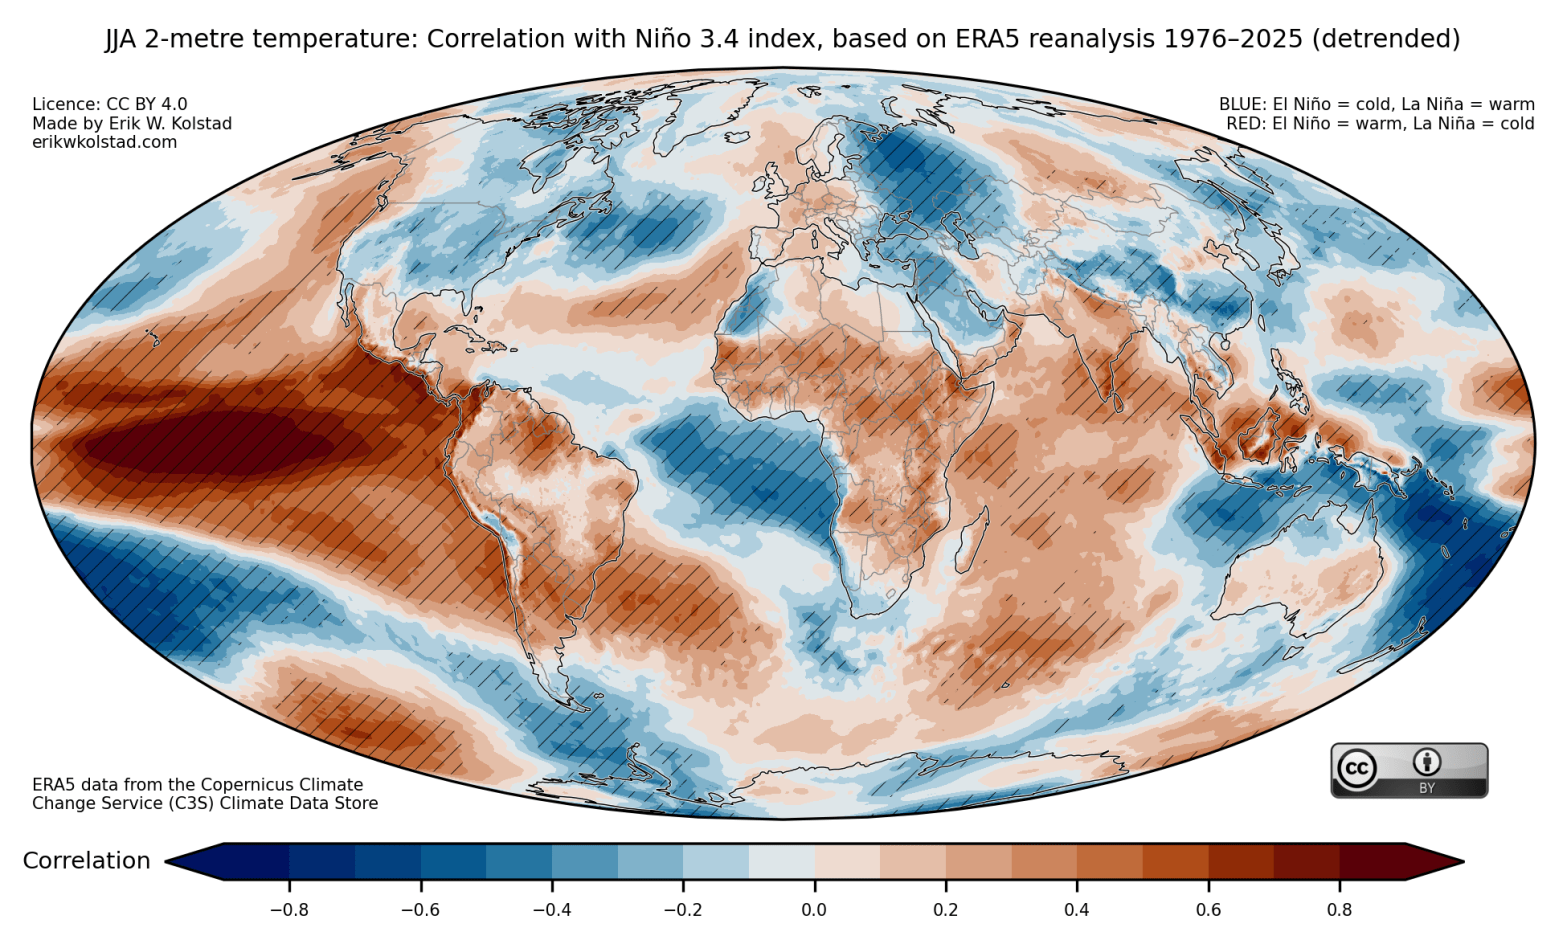
Update on 20 May 2026: Added maps for sea level pressure, thanks to a suggestion by Scott Osprey About three years ago, I made some maps illustrating the global relationships between El Niño/La Niña and temperature and precipitation. These have turned out to be quite popular, so I updated them (and added maps for seaFortsett å lese «Updated maps of El Niño/La Niña effects on temperature, rainfall, and pressure»
-
Abonner
Abbonert
Har du allerede en WordPress.com-konto? Logg inn nå.
